
Private market forecasting is the practice of projecting the capital calls, distributions, and net asset value of illiquid holdings. Family offices and wealth managers use it to plan and proactively manage liquidity. It matters more every year: Preqin projects global alternatives AUM will reach $32 trillion by 2030, and alternatives already make up 44% of the average family office portfolio (UBS, 2025).
Key Takeaways
- Private market forecasting projects the timing and size of capital calls, distributions, and net asset value across drawdown funds.
- Private markets behave differently from public markets. Lagged, mark-to-market valuations and different correlation structures mean public market tools don’t work.
- Any forecast rests on key assumptions like fund life, contribution rate, growth rate, and the distribution curve. Family offices can model these assumptions to arrive at a defensible forecast.
- Forecasts should live in the same place as your portfolio data, so when assumptions or holdings change, the forecast updates accordingly.
What is private market forecasting?
Private market forecasting is how you predict what a portfolio of private investments will do next. If you want to know how much capital will be called, when distributions will return, and how net asset value will fluctuate in the meantime, private market forecasting holds the answers. It’s the forward-looking companion to reporting; while reporting tells a family what it owns today, forecasting tells it what’s coming.
The mechanics of any forecast mirror those of the private investments themselves. Across buyout funds, growth equity, venture capital, and private credit, capital is committed, but not deployed all at once. A fund draws on that commitment over years by issuing capital calls to investors. The investors send the capital, then the fund holds and grows the assets, before eventually returning the funds through distributions.
When capital sits unused (before a capital call is issued for it), it’s considered unallocated. Private market forecasting aims to capture the balance of unallocated capital, as well as the timing and size of capital calls and distributions, across every holding at once.
Note that this applies to drawdown funds, which are the closed-end, capital-call structures that dominate private equity and credit markets. Evergreen funds, in which capital is generally invested on entry, are straightforward by comparison. Drawdown funds and the challenges associated with accurately forecasting their flows can break a family office’s liquidity plan if the assumptions, models, or data that power them are fragile.
Why do private markets behave differently from public markets?
Public equities are marked to market continuously; the price is agreed-upon by all market participants and always available. Private equities, on the other hand, report lagged valuations on a quarterly cadence, so net asset value is always an estimate. A family that manages liquidity based only on public market models, where positions can be sold on any trading day, isn’t accounting for the inherent illiquidity of the private side of the book.
The differences compound. Private and public assets have different correlation structures, so a 60/40 liquidity buffer sized against global equities says little about how much cash a private portfolio will demand next quarter. Capital is called on the general partner’s schedule, not the family’s, and distributions arrive years after the capital is committed. This is the J-curve most principals know by name and few can model by date.
Because mark-to-market valuations lag and quarterly returns arrive late, the questions that inform liquidity planning (like how much will be called, and when will it come back) cannot be answered by watching valuation levels or a price-earnings ratio. They have to be projected.
How big is the private markets shift for family offices?
For most family offices and UHNW investors, the exposure now justifies the effort. Alternatives make up 44% of the average family office portfolio, and among US family offices the figure is 54%, with 27% in private equity, 18% in real estate including multifamily real estate, and 3% in private debt (UBS Global Family Office Report 2025). Private investment is no longer another sleeve of the portfolio; for many families, it is the center of gravity.
The direction of travel is just as clear. The number of family offices allocating to private markets has grown 524% since 2016, from 651 to 4,067 (Preqin). And 60% of family offices told UBS they plan to change their strategic asset allocation over the next 12 months, up from 35% a year earlier. That means allocation drift and its liquidity consequences are a live governance issue, not a once-a-year review.
For a deeper treatment of the cash side, see our guidance on family office cash flow.
What will private markets look like by 2030?
The forecast for the asset class itself is one of sustained growth. In its Private Markets in 2030 report, Preqin (now part of BlackRock) expects global alternatives AUM to reach $32 trillion by 2030, spanning private equity, private credit, infrastructure, real estate, hedge funds, and natural resources. Private credit alone is expected to climb to $4.5 trillion, driven by bank disintermediation and new liquidity-driven fund structures, while infrastructure approaches $3 trillion.
The report was framed in a fireside chat between Wei Li, Global Chief Investment Strategist at BlackRock, and Mark O’Hare, Vice Chairman at BlackRock and the founder of Preqin. Their throughline: artificial intelligence is becoming a primary growth driver for venture capital investment and private equity, from AI unicorns and Chinese AI companies to defense tech, reshaping VC ecosystems and where capital flows. BlackRock’s own Investment Institute frames the same trend as private markets growing from roughly $13 trillion today to more than $20 trillion by 2030.
That future is what capital market assumptions are for. Analysts lean on frameworks like BlackRock’s capital market assumptions and the Vanguard Capital Markets Model, macro forecasts from houses such as Oxford Economics, and data services including Preqin Insights+ and its global private market trends, cross-checked against public benchmarks like the FactSet US Index and the MSCI U.S. Broad Market Index and their sector indices. Those inputs set the expected returns; a private market forecast turns them into cash flow and liquidity for a specific book of funds.
What macro forces move a private market forecast?
Interest rates sit at the center. They reset discount rates, valuation spreads, and the pace of private equity transactions, which in turn determines when fund managers will call capital and when they will distribute. Inflation targets and the broader global macroeconomic outlook shape the same timeline from the other direction.
Around that core, a wider macro-economic backdrop moves the forecast: central bank liquidity injections, the strength of economic recoveries, earnings growth, consumer confidence, and periodic market shocks all push distribution timing earlier or later. When distributions slow, families look to the secondary market for a liquidity solution. LP secondaries volume hit a record $87 billion in 2024, and industry estimates see total secondaries reaching roughly $300 billion by 2030. When primary distributions stall, secondaries offer a release valve.
The scale of committed-but-uncalled capital explains the pressure. Closed-end private capital funds held $4.63 trillion of dry powder at the end of Q2 2025 (Preqin). This is capital that will be called on a schedule that the family does not control. Forecasting is how a family office prepares. The trade-off between liquidity vs. performance is settled based on private market forecasts, which are in turn based on data, assumptions, and models.
What makes a private market forecast defensible?
A forecast is only as good as the assumptions behind it. To deliver a high-quality forecast, those assumptions must be explicit, controllable, and consistent.
1. Assumptions you can control
A defensible model is built from a small set of parameters: fund life, the shape of the distribution curve (the bow), contribution rate, growth rate, and yield. Set them at the level that fits security type, strategy, vintage, or an individual fund, and the forecast will reflect how each part of the portfolio actually behaves. This is the Yale Model framework, developed by Dean Takahashi and Seth Alexander in 2001. It’s still the standard reference for cash flow forecasting of private funds.
2. Timing conventions and current-year activity
The original framework projects across full years, but real portfolios move within them. A usable forecast handles intra-year timing and current-year activity, including the calls and distributions that have already happened this year. It also lets you choose a beginning-of-year, mid-year, or end-of-year convention per portfolio so figures line up with how you report.
3. Reference portfolios and liquidity
Liquidity is a relationship, not an absolute. Expressing unfunded commitment as a percentage of a reference portfolio you define, whether that’s cash plus fixed income, or whatever actually backs your commitments, answers what a principal really wants to know: how liquid am I if the market turns? Forecasting converts a pile of commitments into a clear picture of the family’s capacity.
4. Benchmarking and stress testing
It’s also important to judge any forecast against reality. Direct Alpha and other similar measures test whether manager selection is adding more value than the public market. Academic research goes further, using predictive analytics to forecast fundraising and outcomes. Finally, a stress test scenario model and disciplined portfolio analytics can allow you to pressure-test the forecast against rate shocks and delayed distributions before those shocks arrive.
Why spreadsheets break private market forecasting
Most family offices run their forecasts in Excel, which works until it doesn’t. The specific failures are predictable. One analyst owns the model, so it carries inherent key-person risk. A single wrong cell reference can put a faulty number in front of the principal. Assumptions are buried and not versioned, so no one can say why last quarter’s forecast differed from this one. Nothing downstream recalculates when a call lands or a NAV updates.
The fix is not a better spreadsheet. It’s data transformation and aggregation into integrated systems and real-time dashboards, where the forecast lives alongside the holdings that feed it and updates when they do. A similar shift is what caused family offices and UHNWI to consider moving off spreadsheets a decade ago. Today, the same shift is taking place, applied to the forward view.
How Masttro forecasts private markets: Cash Projection Hub
Cash Projection Hub is Masttro’s forecasting engine for closed-end funds and the portfolio around them. It is built on the Yale Model framework and extended for the intra-year timing and current-year activity the original does not handle, so the projection reflects where a portfolio actually stands.
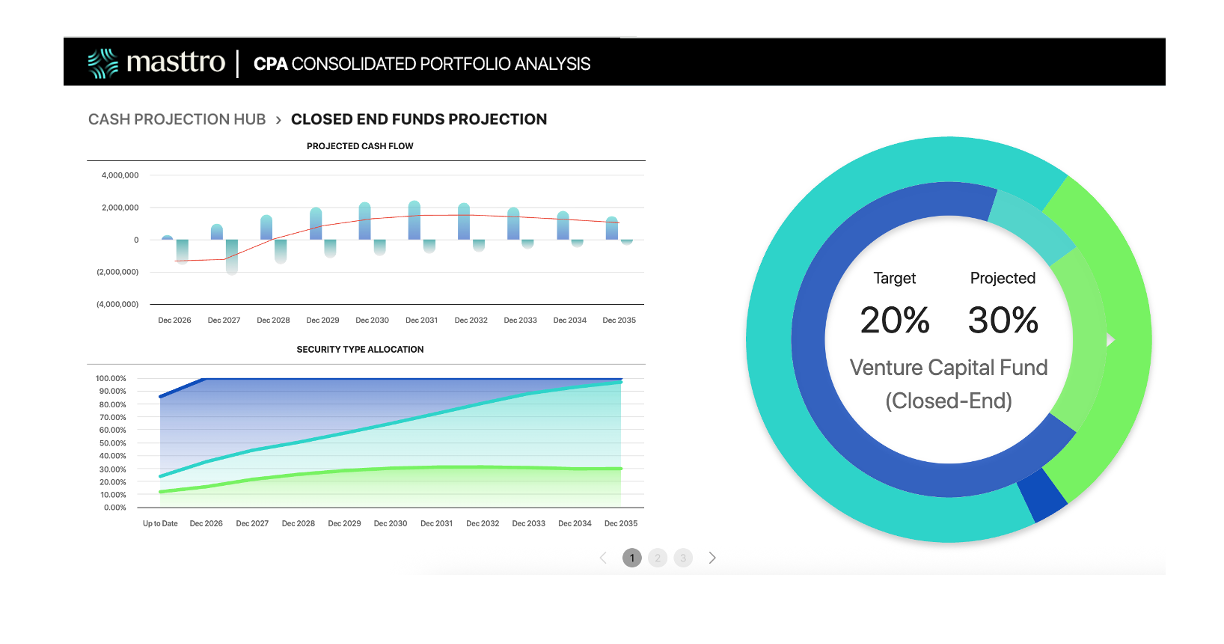
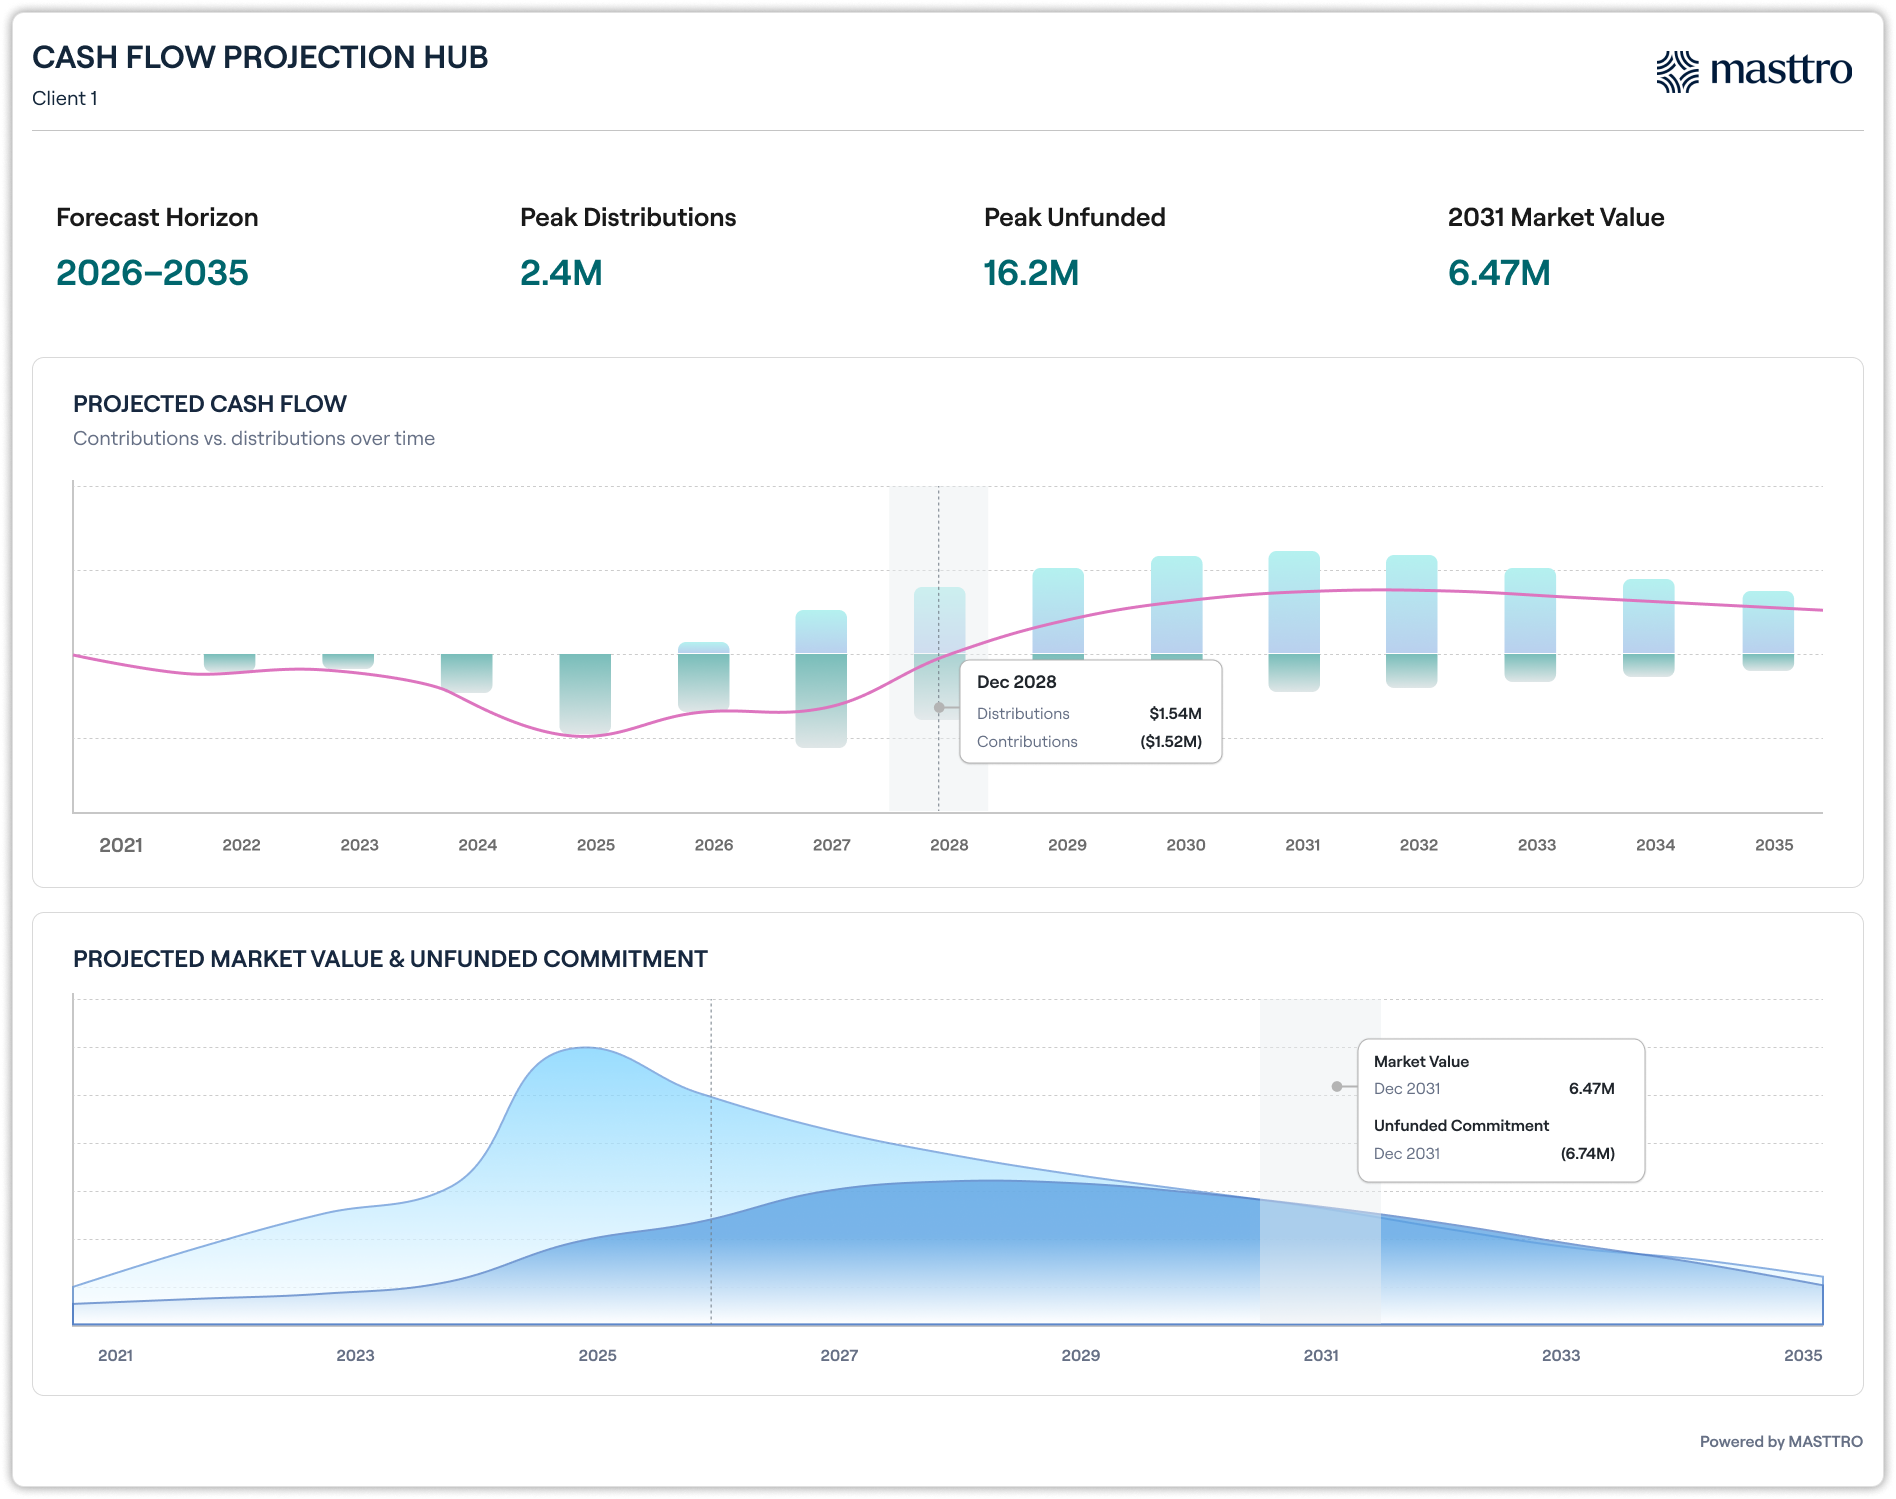
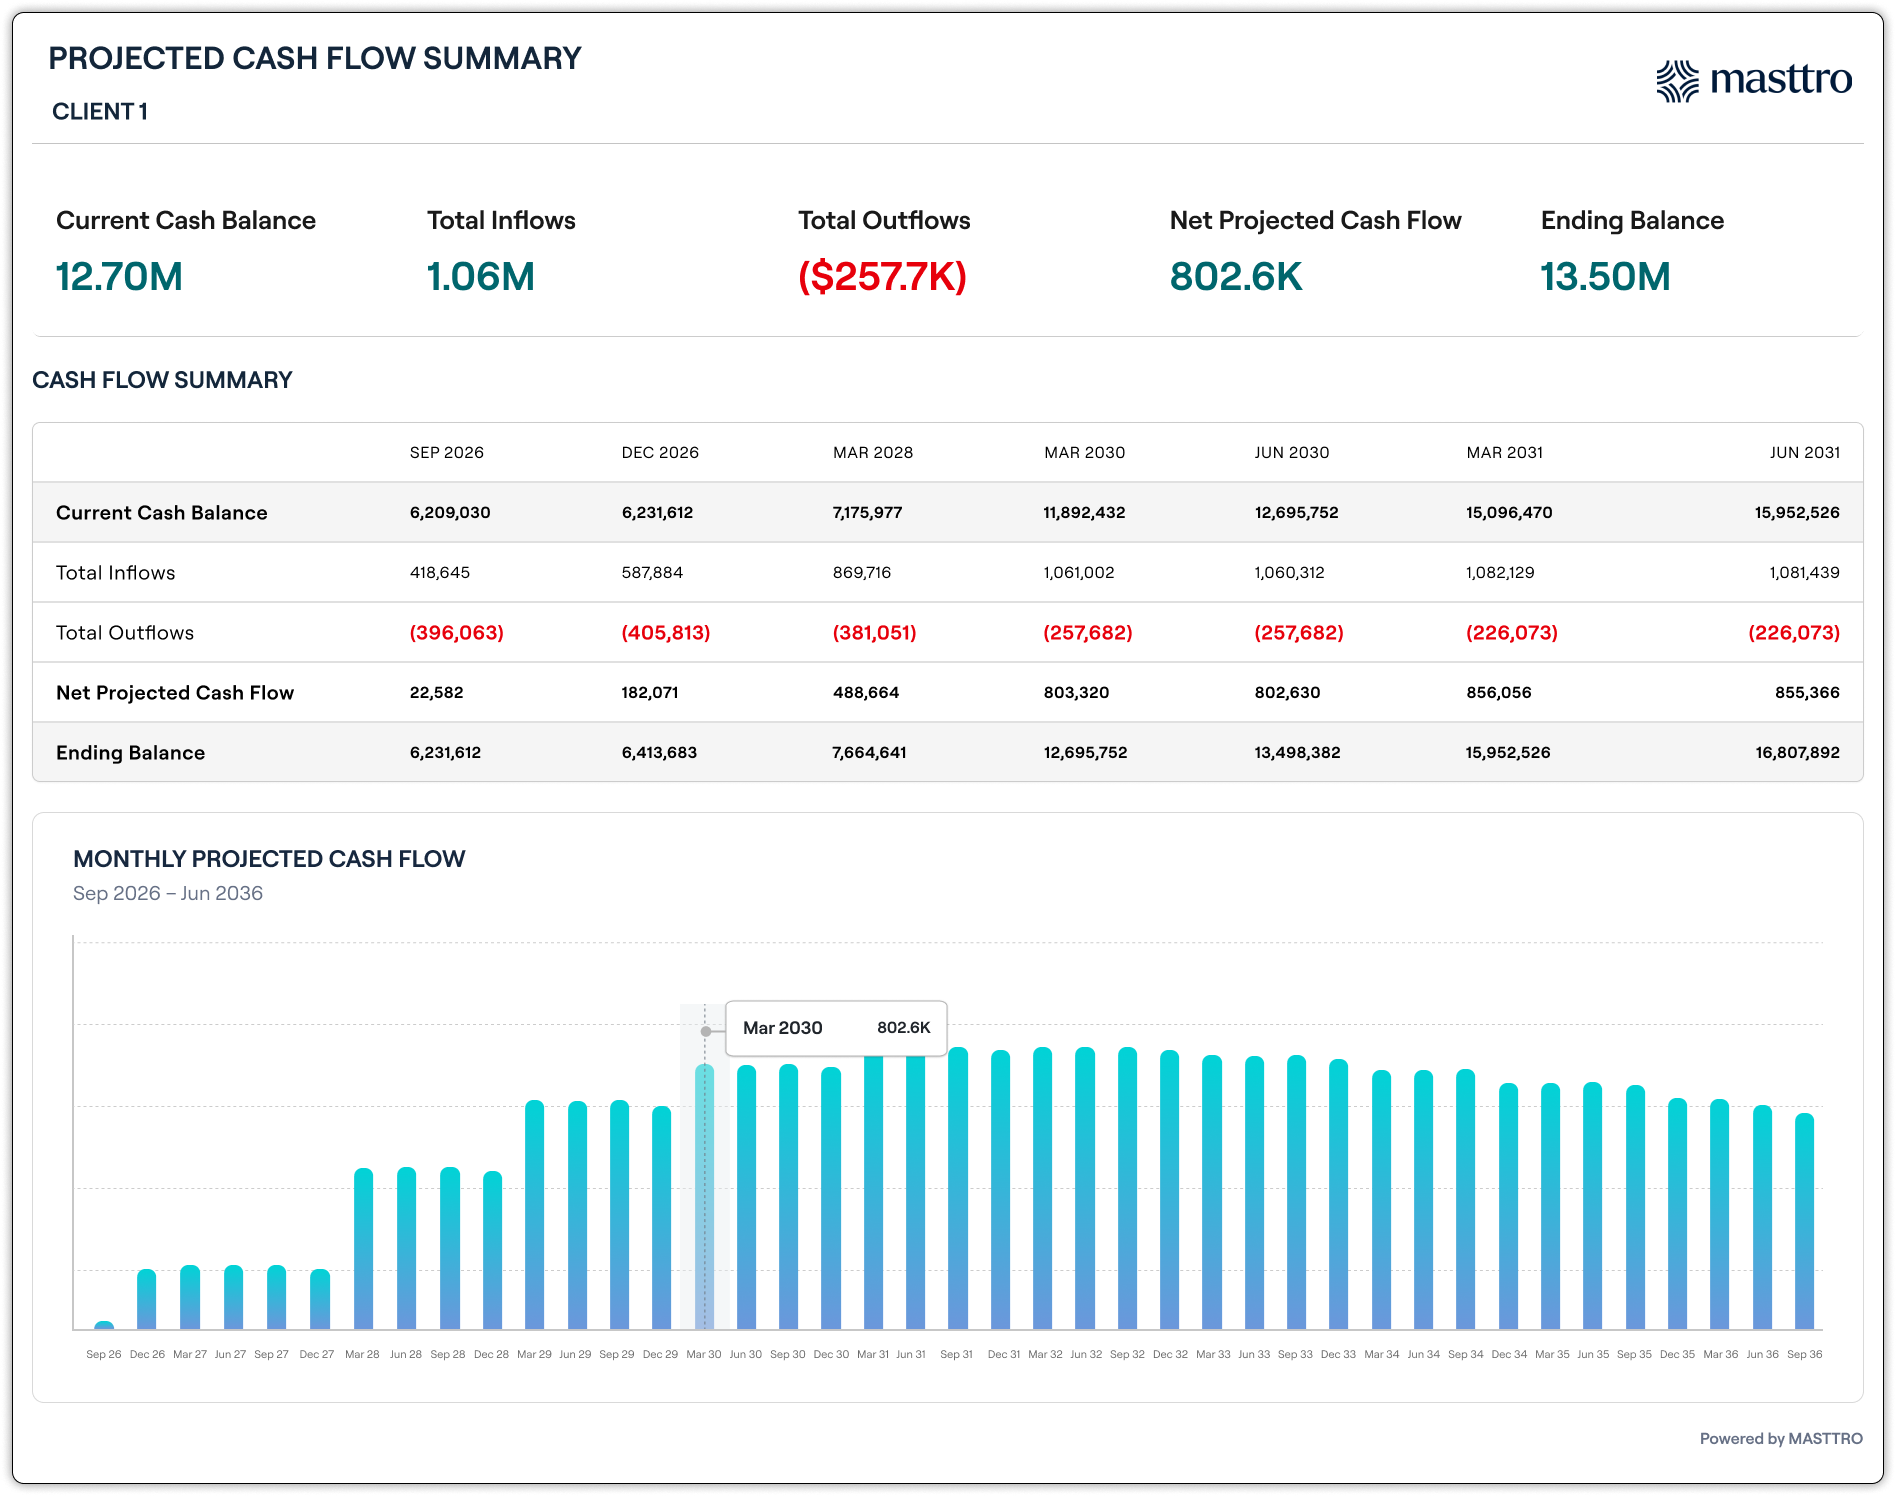
It puts the method above into one live view. A projection dashboard shows capital calls, distributions, net asset value, unfunded commitment, and projected allocation across every closed-end fund, alongside a market value projection for the rest of the book. Assumptions are yours to set at security type, strategy, vintage, or individual fund, with clean overrides that inherit down a four-level hierarchy. You can also apply different parameters to the same fund across different client families from one platform. Allocation drift is visible against target, unfunded commitment is shown against the reference portfolio you define, and historical and projected activity sit on one timeline with up to seven variables.
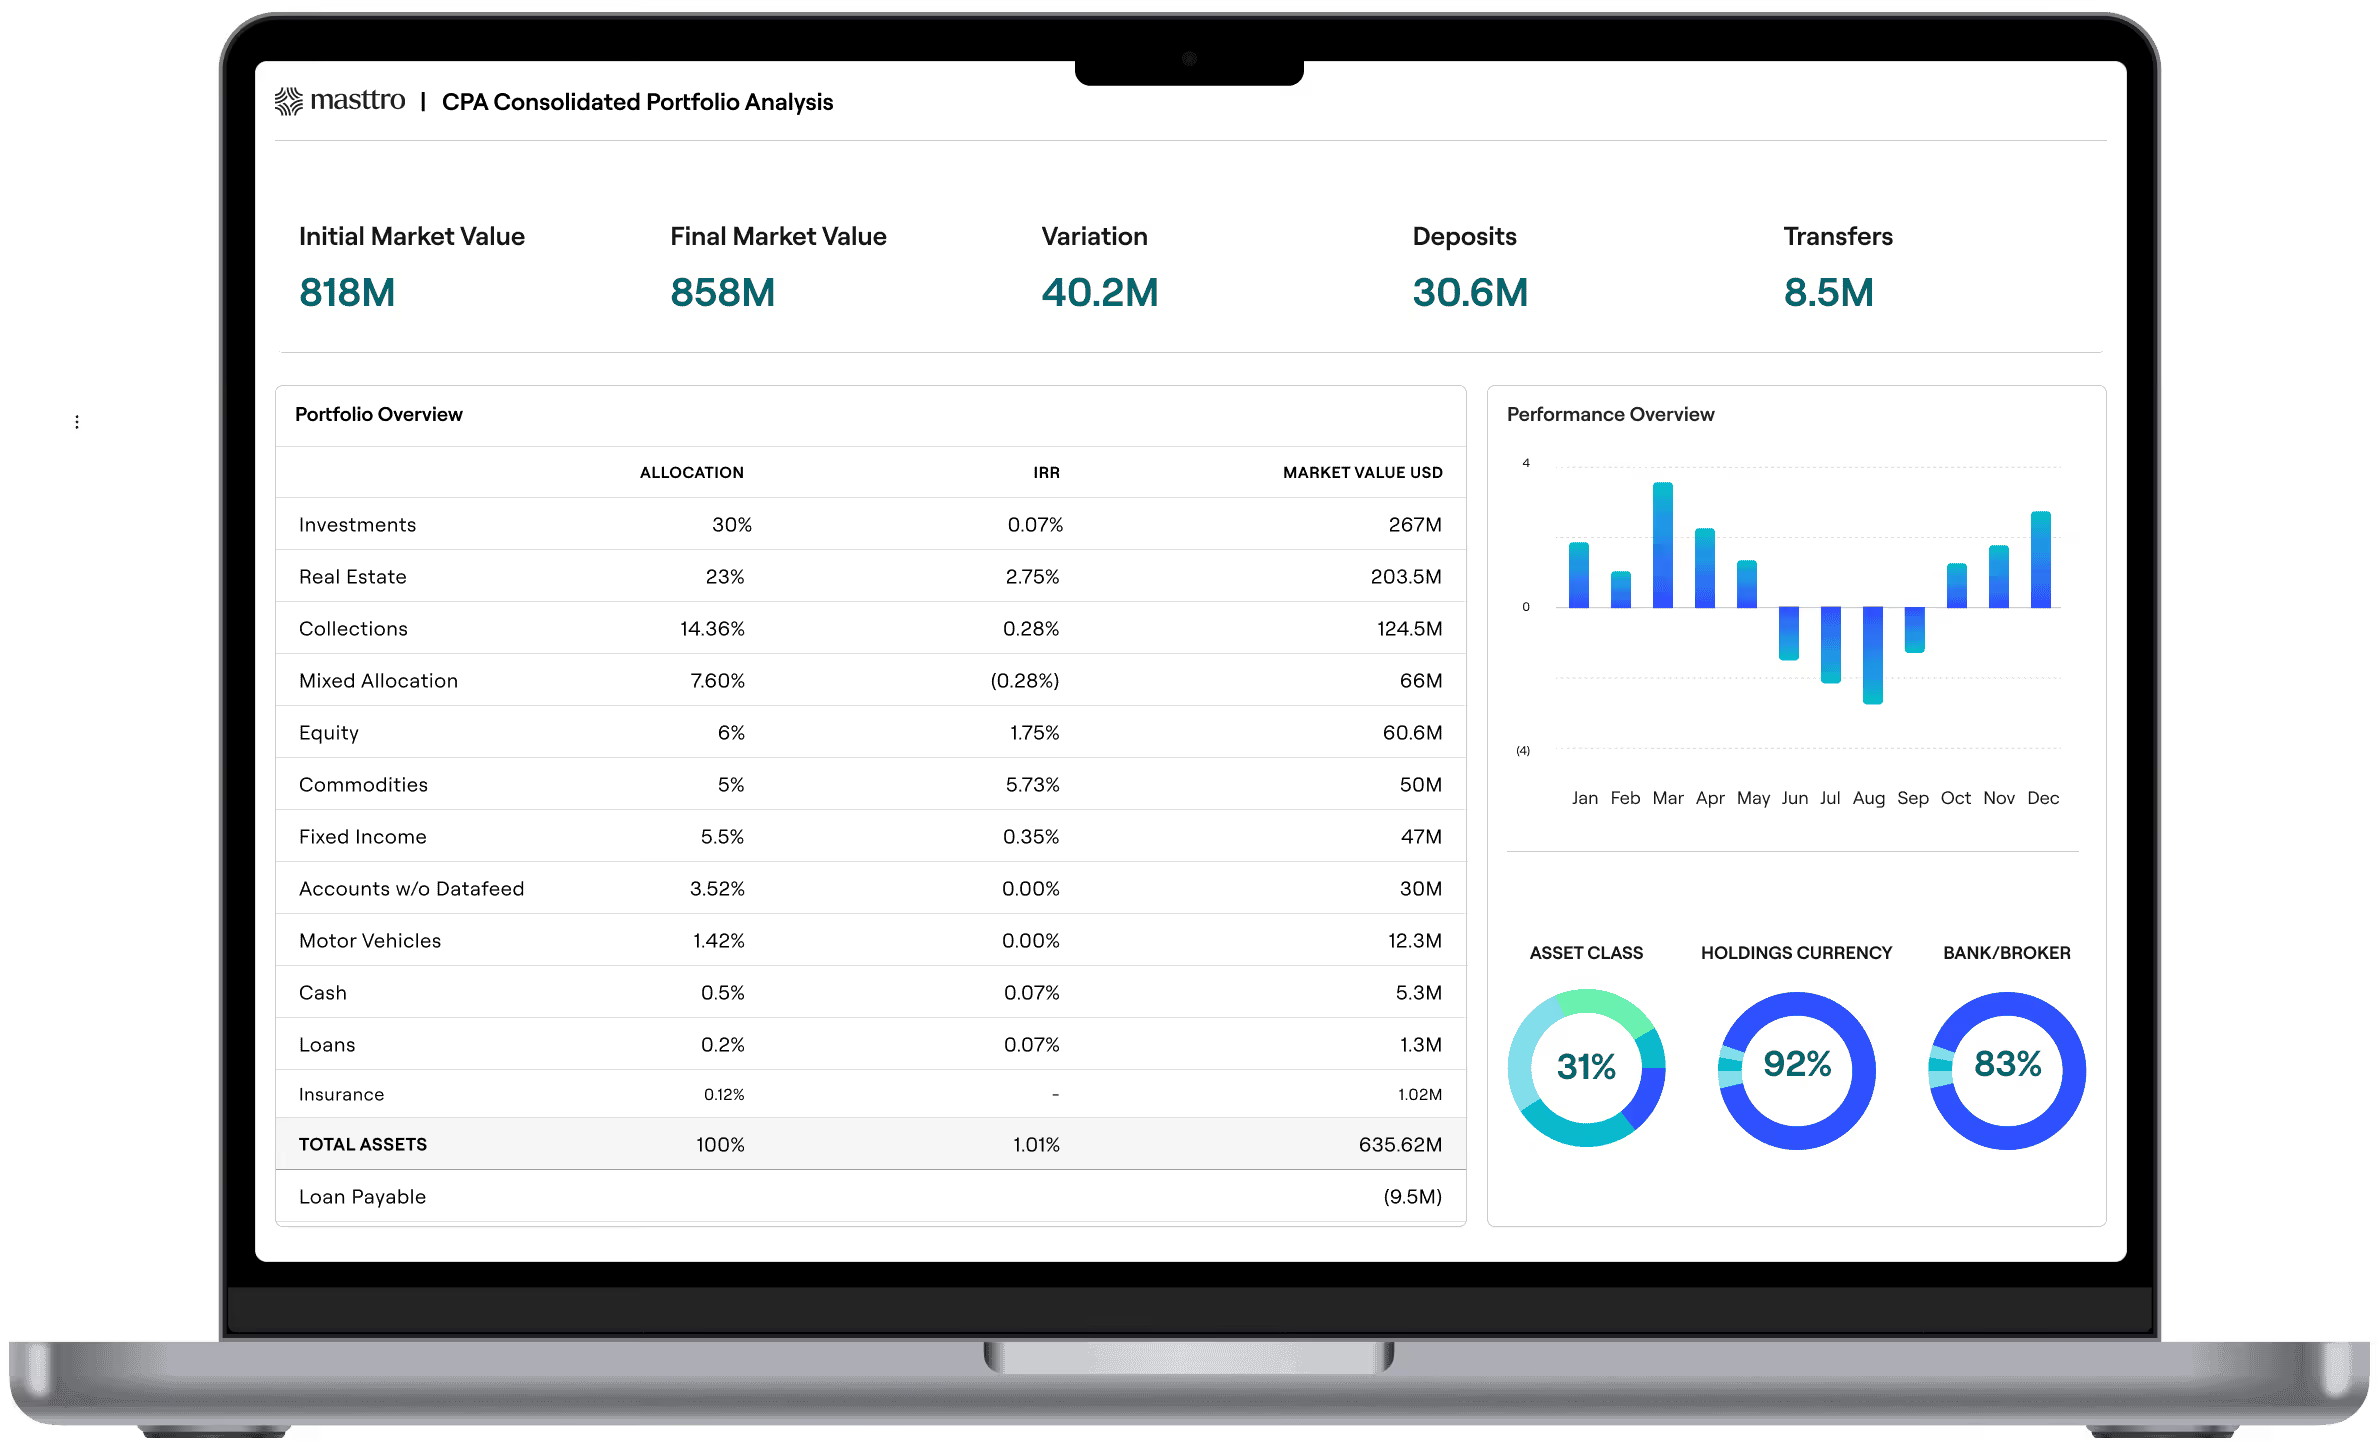
Because it is built natively into Masttro, the forecast is powered by the same data that already exists on the platform. The Alternatives AI and Documents AI suites ingest and tag capital calls, distributions, and NAV statements. Data aggregation keeps positions current and auditable across 700+ custodians in 40+ countries. The forecast appears inside Consolidated Portfolio Analysis next to the reporting a family already uses. Day-to-day liquidity across accounts and entities continues to live in the Cash Management Registry.
Projections are model-based estimates, not guarantees. Capital call timing ultimately depends on general partner decisions which no model can predict, so the objective is methodological rigor and consistency, not absolute certainty. Finally, keep in mind that Cash Projection Hub is forward-looking; historical data continues to live in your existing Masttro reports rather than being restated.
Private market forecasting in practice
The payoff is a forecast that holds up in front of the family. Masttro clients describe the shift from fragmented tracking to one consolidated view. As Saul Dyne of Stonebridge Family Office put it, “we went from having no consolidation tool or data feeds to having both capabilities in a single platform — that also happens to track private equity investments perfectly.”
Getting the underlying private markets data clean is the precondition for forecasting it, which is why strong private equity portfolio monitoring and disciplined alternative investment reporting sit upstream of any projection. Once the record is trustworthy, the forecast built on top of it is defensible.
Frequently asked questions
What is private market forecasting?
Private market forecasting is the projection of capital calls, distributions, and net asset value across private fund interests, so a family office can plan liquidity in advance. It converts committed-but-uncalled capital and lagged valuations into an expected schedule of cash in and cash out over a chosen horizon.
How do family offices forecast capital calls and distributions?
They model each fund from a small set of assumptions, like fund life, contribution rate, growth rate, and the distribution curve. Typically, modeling is handled using the Yale Model framework. Applied across every fund and combined with current holdings, those assumptions produce a projected timeline of calls and distributions that updates as positions change.
How is forecasting private markets different from forecasting public markets?
Public equities are priced continuously and can be sold on any trading day; private funds report lagged, quarterly valuations and return capital on the general partner’s schedule. Different correlation structures and mark-to-market timing mean public market liquidity tools do not transfer to private investments.
What is the Yale Model for private market cash flows?
The Yale Model is a framework developed by Dean Takahashi and Seth Alexander in 2001 to project private fund cash flows (i.e., capital calls, growth, and distributions) over a fund’s life from a few assumptions. It remains the standard reference for forecasting private market commitments.
Can you forecast private markets in Excel?
You can, until the model breaks or the analyst who built it leaves. Spreadsheets carry key-person risk, are one cell reference away from a wrong answer, and do not recalculate when a call lands or a valuation updates. At scale, the spreadsheet becomes the risk it was meant to manage.
How much will private markets grow by 2030?
Preqin’s Private Markets in 2030 report projects global alternatives AUM reaching $32 trillion by 2030, with private credit climbing toward $4.5 trillion. BlackRock’s Investment Institute frames private markets growing from roughly $13 trillion today to more than $20 trillion over the same period.
See what’s coming, not just what you own
Reporting tells wealth owners what they hold. Forecasting tells them what is coming. A forward view of private markets answers the question every principal asks: where is my cash going to be?
To see how Cash Projection Hub projects calls, distributions, and liquidity inside the platform that already holds your data, book a demo.
Key Takeaways