Forecast every fund. Foresee every commitment.
Alternatives don't behave like the rest of the portfolio. Capital is called on the GP's schedule, distributions arrive years later, and NAV lags. Cash Projection Hub forecasts all of it for every closed-end fund, from assumptions you control.


Key features
Cash Projection Hub
A forecasting engine built specifically for closed-end funds. Using the Yale Model framework, extended for intra-year timing and current-year activity, it projects capital calls, distributions, NAV, unfunded commitments, and allocation drift.
You control the assumptions. Every number comes from data already in your secure environment, and recalculates the moment an assumption changes.
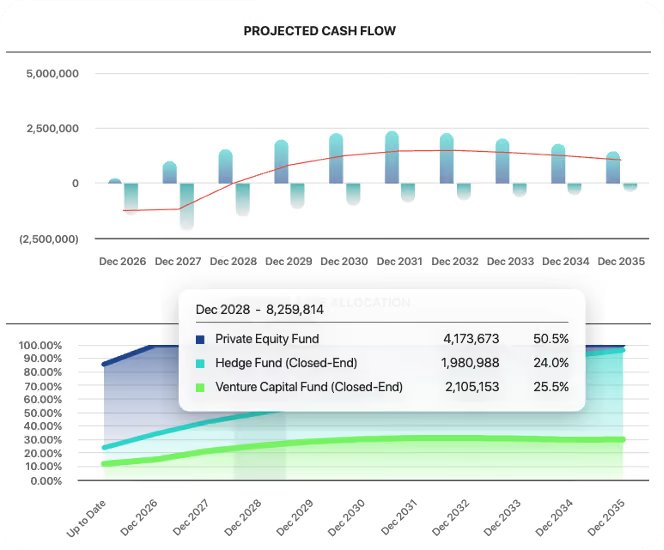
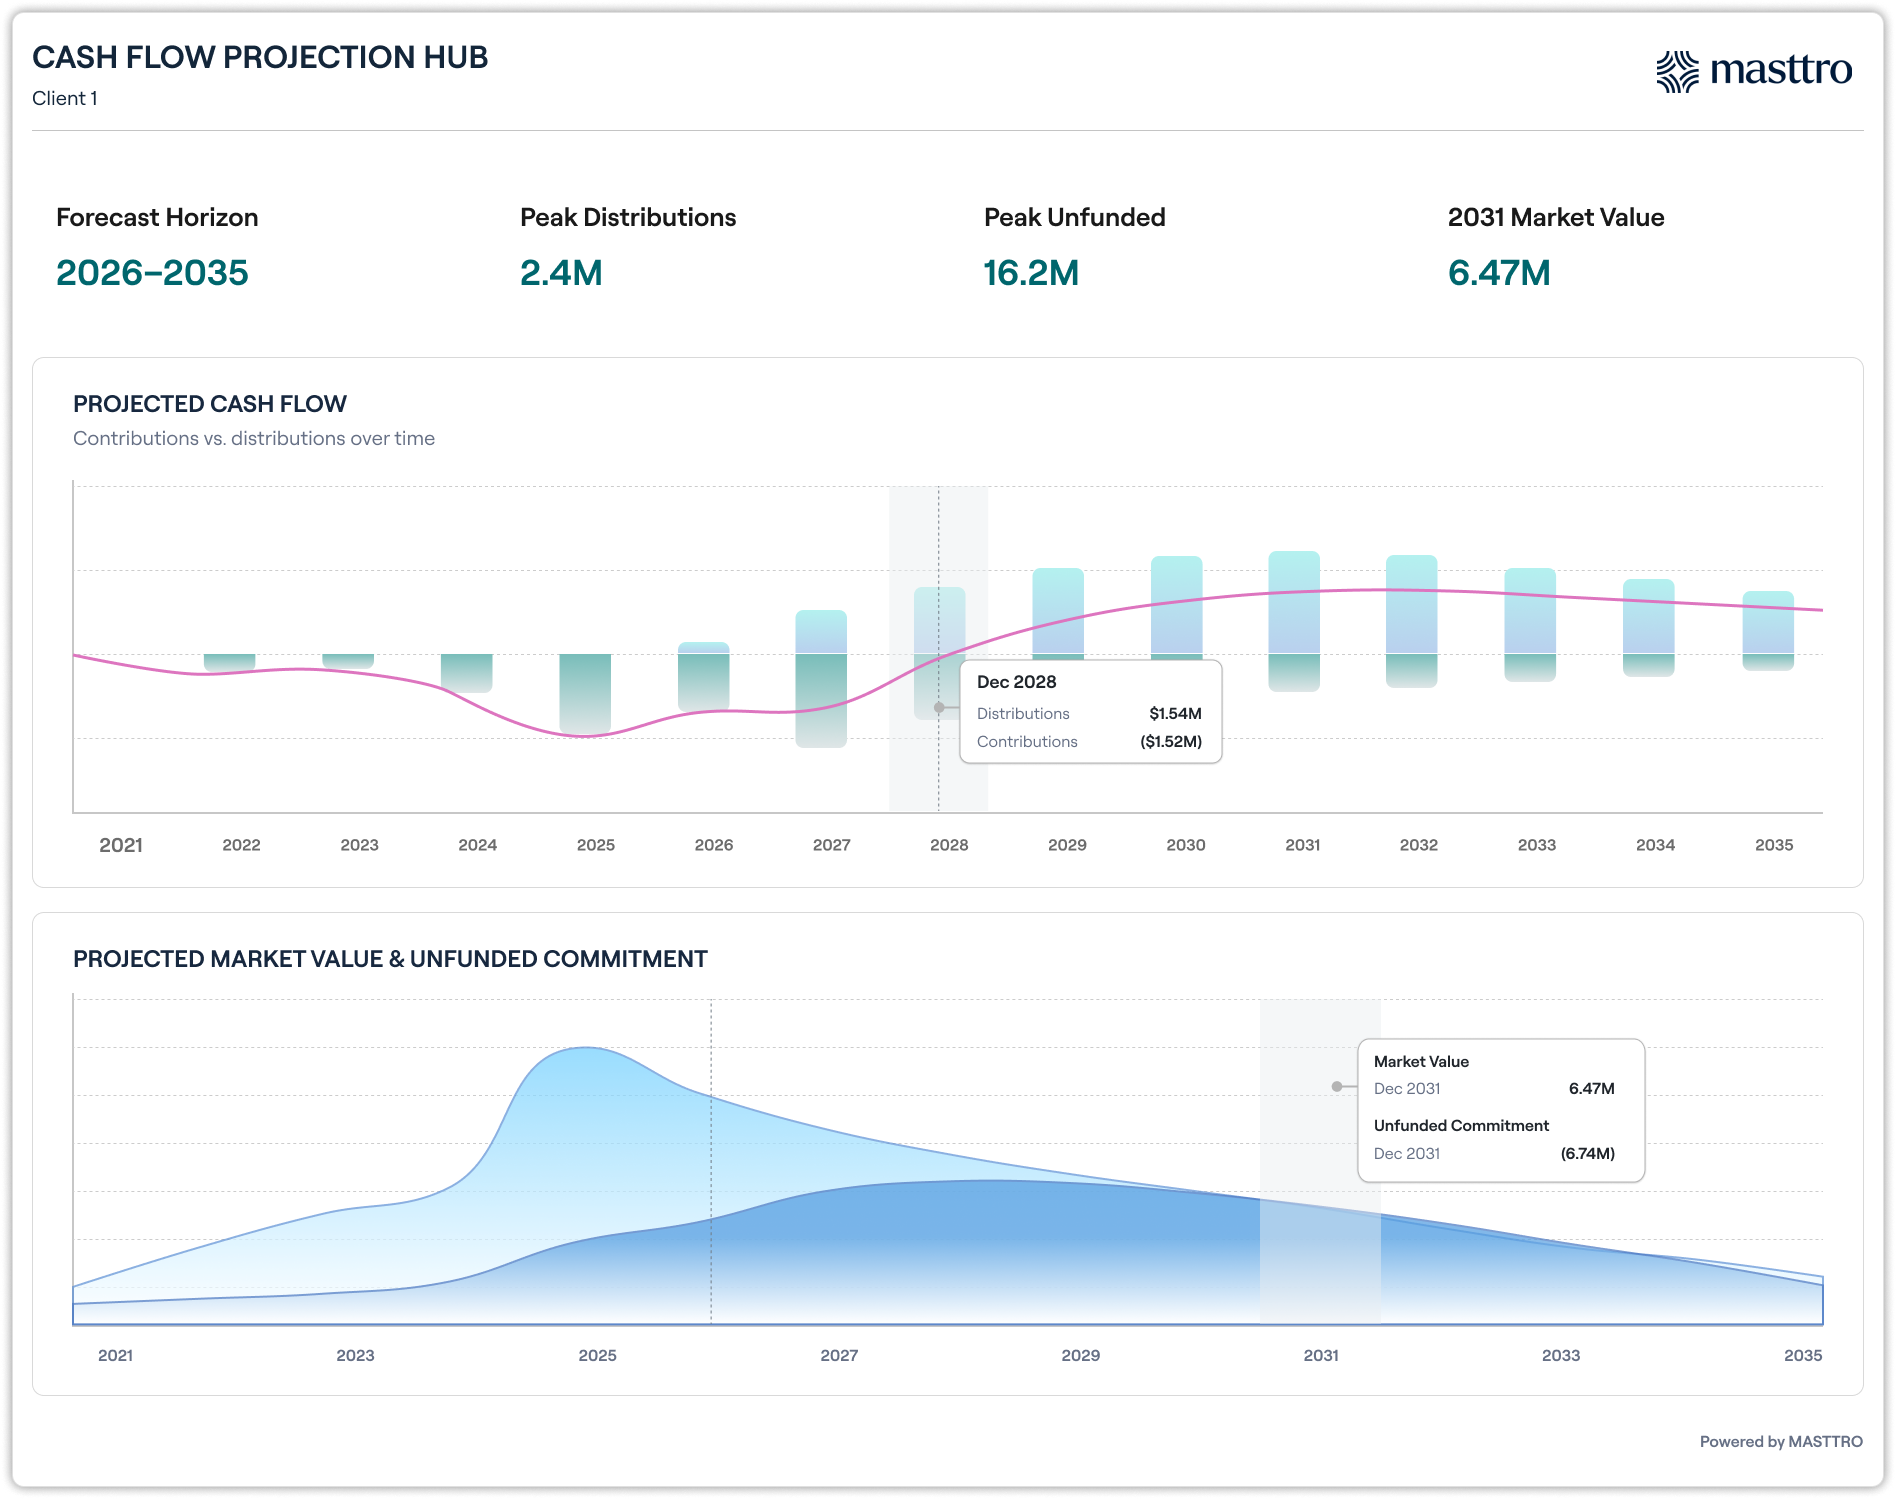
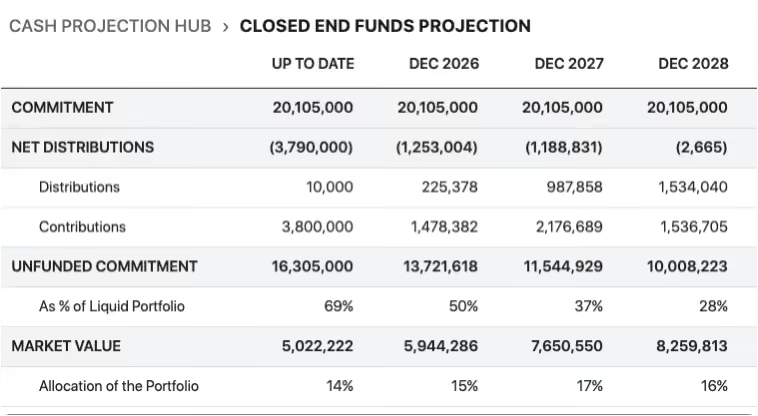
Projects calls, distributions, NAV, and unfunded commitment across every fund
Built natively into Masttro and powered by your existing aggregated data
Compares projected allocation against target so overweights surface early
Set assumptions by security type, strategy, vintage, or individual fund
Different parameters for the same fund across different client families
Unfunded commitment shown as a percentage of a user-defined reference portfolio
Historical and projected activity on one timeline, with up to seven variables
A forecast you can defend
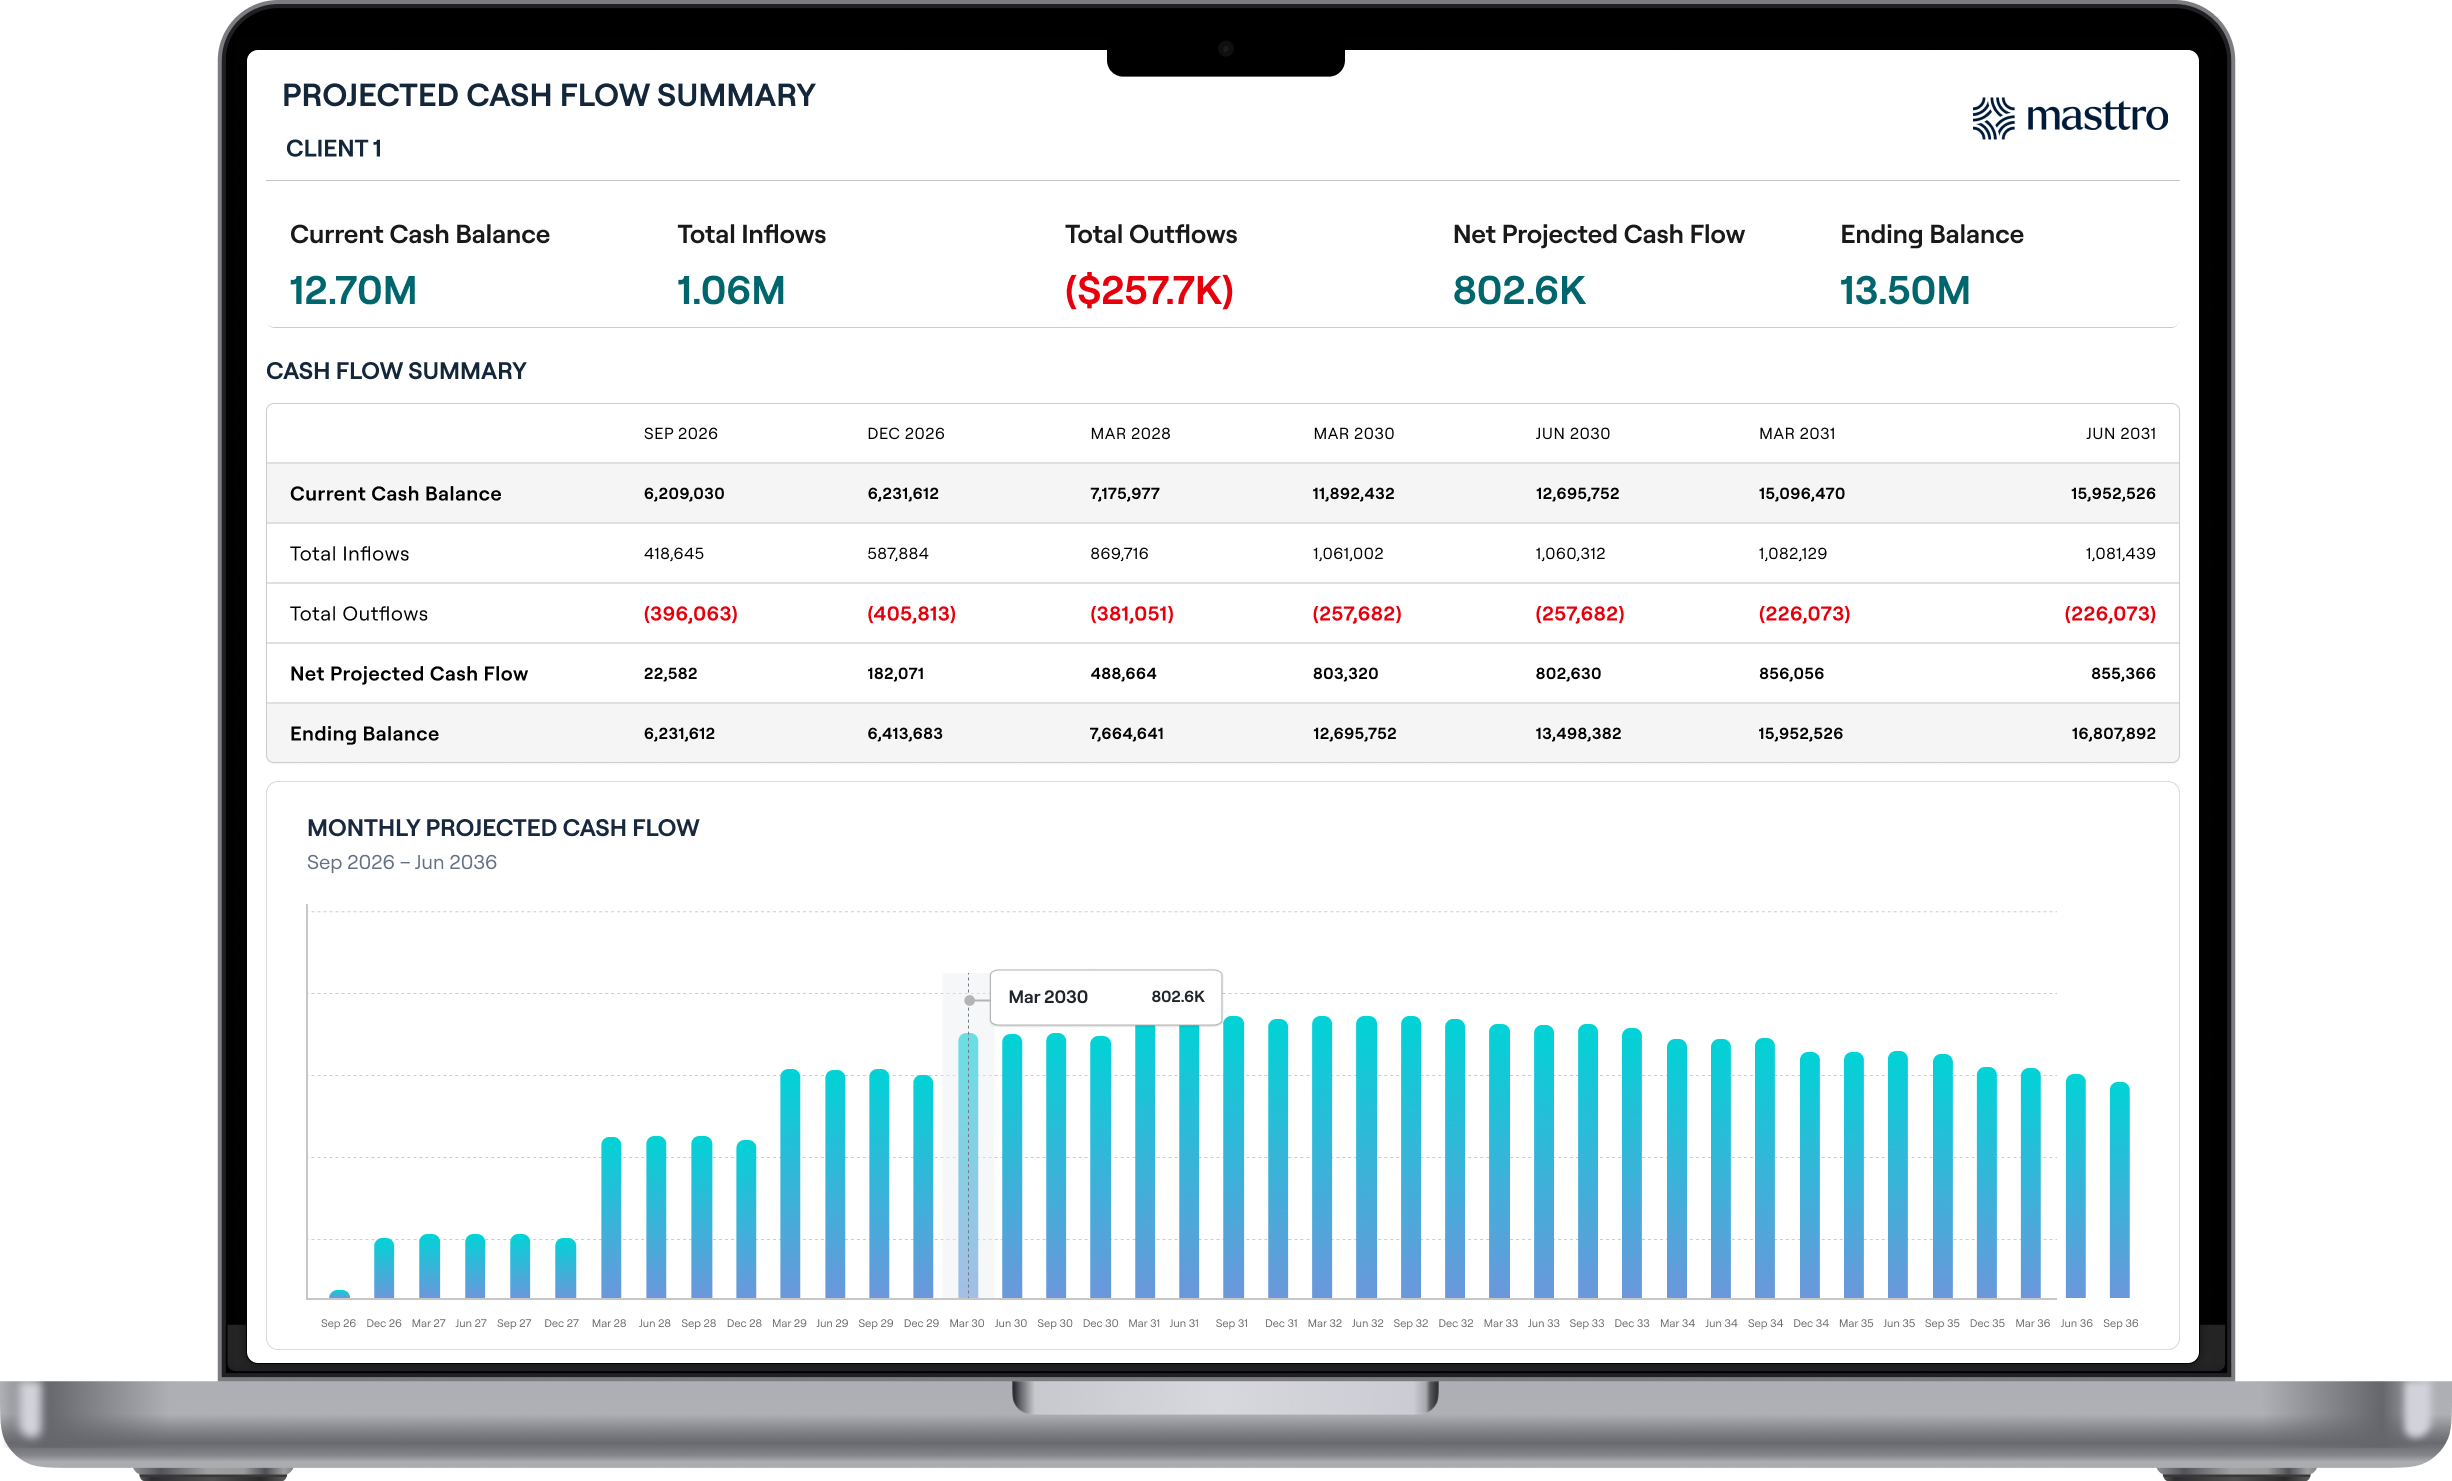
One live view of NAV, capital calls, distributions, unfunded commitment, and projected allocation across every closed-end fund. The rest of the portfolio gets a market value projection.
Every figure is system-calculated and recalculates the moment an assumption changes. The methodology is built on a published framework and stays consistent from one reporting period to the next.
Model on your terms
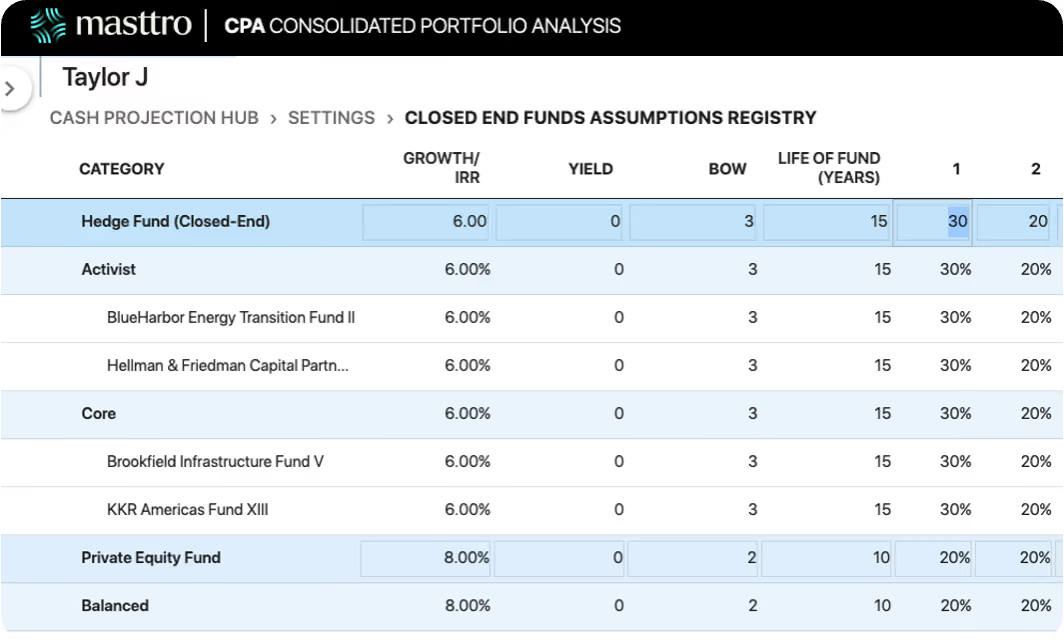
Set Fund Life, Bow, Contribution %, Growth Rate, and Yield at the level that fits: security type, strategy, vintage, or an individual fund. Bow governs how back-loaded the distribution curve is. Values cascade down the four-level assumption registry, and an override at any level leaves the rest of the hierarchy intact. Apply different parameters to the same fund across different families.
Catch drift while you can still act
Compare projected allocation against target in a single view. The engine projects calls and distributions across the forecast horizon, surfacing drift while new commitments can still correct it. Target and projected sit side by side for every strategy, at each point across the horizon, measured against total portfolio value rather than just the private book.
Measure liquidity, as defined by you
See unfunded commitment as a percentage of a reference portfolio you define, like cash plus fixed income or whatever liquidity backs your commitments.
Set the timing convention per portfolio: beginning, middle, or end of year. Adjusting when the projected cash flows land within each period ensures that the forecast aligns with how the portfolio already reports.
History and forecast on one timeline
Put actual fund behavior and the forward projection on one timeline, with up to seven variables in the time series projection view. Forecast across 1, 2, 3, 5, 7, or 10-year horizons, grouped by month, quarter, or year.
Plan the next decade or the next month using the same timeline and the same numbers.