Wealth flow dashboard
A flow chart from January’s net worth to today’s, with every stream clickable.
Build an interactive dashboard of every dollar’s journey [this year]: starting net worth, flowing through contributions, income, market gains and losses, FX, fees, taxes, withdrawals and capital calls, ending at today’s value. Let me click any stream to see the transactions inside it.
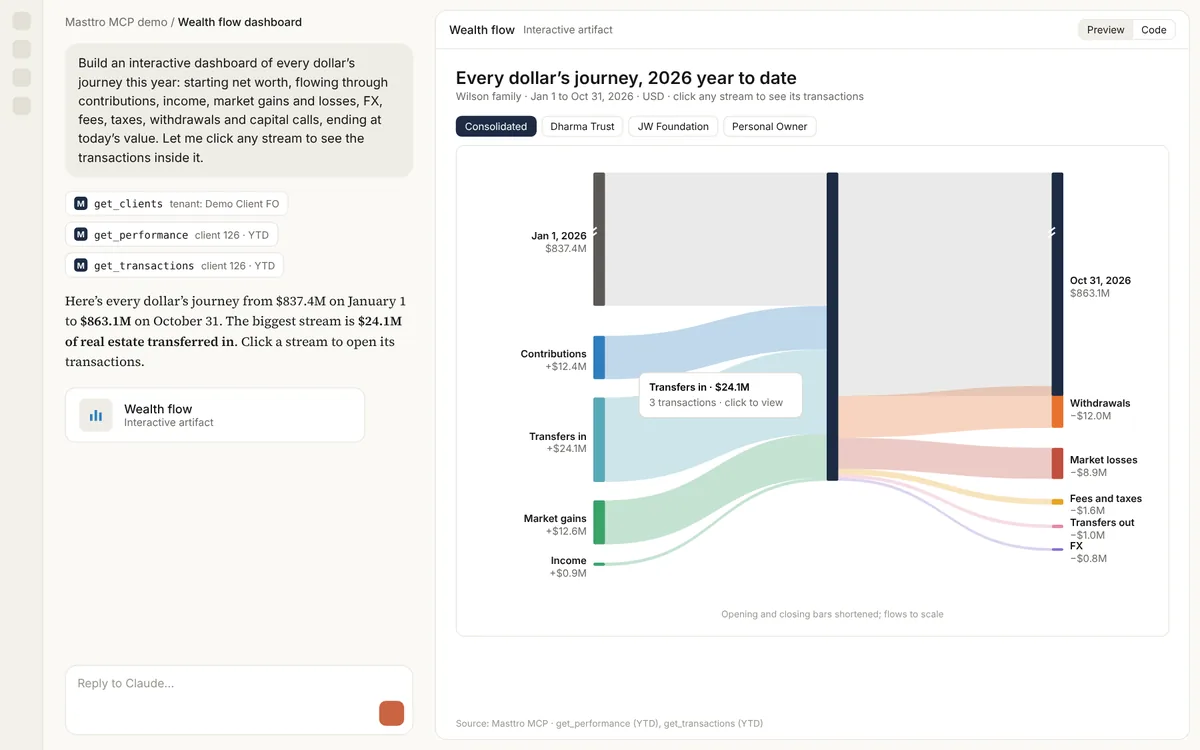
Illustrative output based on Masttro's demo family office data.
A flow from opening net worth to today's value.
Contributions, income, gains and losses, FX, fees, taxes, withdrawals and calls.
Open any stream to see the transactions inside it.
Replace [this year] with the period you want to trace.
Why trace every dollar's journey?
A principal looking at a net worth change wants to know where the money came from and where it went. A flow chart answers that more clearly than any table.
This prompt has the AI build an interactive flow from period performance and every transaction in Masttro, so each stream can be opened to the transactions behind it.
Every source and use of wealth in one view.
Each stream links to its detail.
A follow-up compares with last year's flow.
Questions about this prompt
What data does the dashboard use?
Period performance, including opening and closing value, gains and income, plus every transaction for the period in Masttro.
Can I see one entity's flow?
Yes. The first follow-up shows the flow for a single entity.
Can I split gains by asset class?
Yes. A follow-up breaks market gains down by asset class.
Which AI tools can build it?
Claude can build interactive charts in the conversation. Results vary by tool.