Private markets dashboard
An interactive view of the private markets book by vintage.
Create a private markets dashboard showing commitments, capital called, distributions and value by vintage year as of [month-end], with a filter for each investment vehicle.
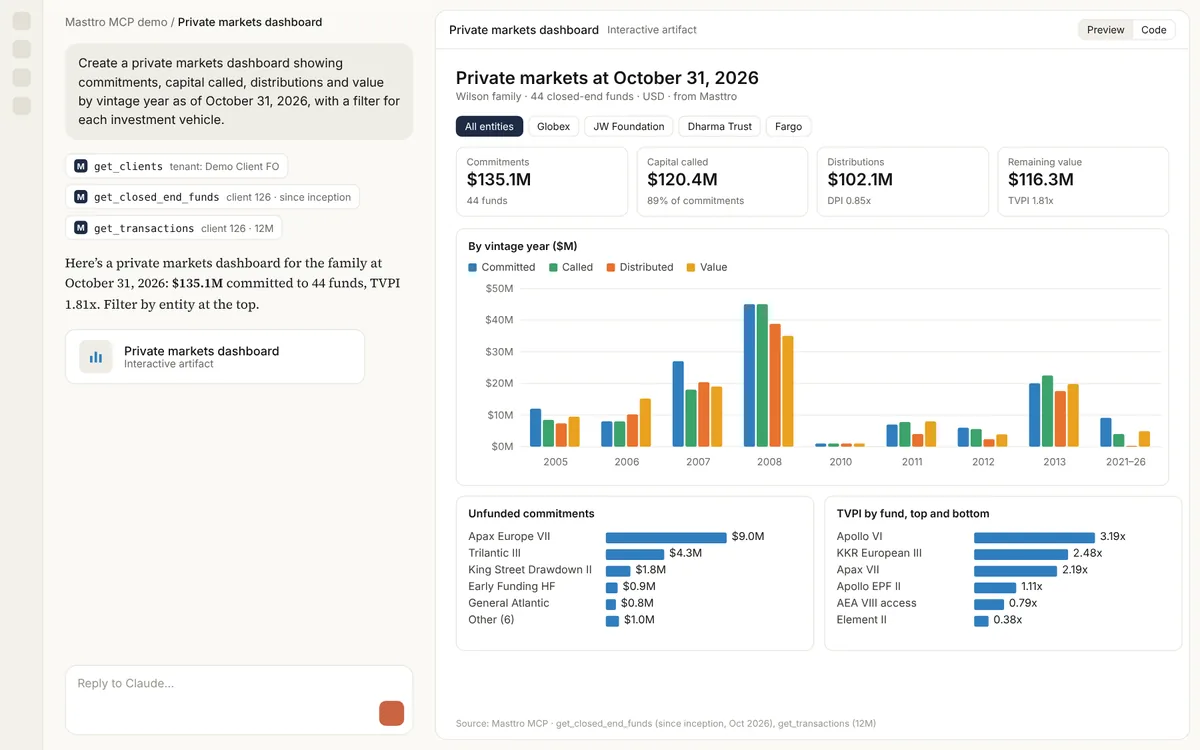
Illustrative output based on Masttro's demo family office data.
Commitments, capital called, distributions and value.
Every metric grouped by the year capital went in.
See any investment vehicle on its own.
Replace [month-end] with the valuation date for the dashboard.
Why build a private markets dashboard?
Private markets data is usually spread across fund reports and spreadsheets. A single interactive view makes it far easier to see pacing, returns and remaining commitments together.
This prompt has the AI build a dashboard from commitments, calls, distributions, value, TVPI and DPI in Masttro, with a filter for each entity.
Filter and explore instead of reading tables.
See how each year's commitments are developing.
Follow-ups add J-curves or a call calendar.
Questions about this prompt
Is the dashboard live?
It is built from Masttro data at the time you ask. Run the prompt again to refresh it.
Which AI tools can build it?
Claude can build interactive dashboards in the conversation. Results vary by tool.
Can I add J-curves?
Yes. The first follow-up adds a J-curve chart for each vintage.
Can it highlight stale valuations?
Yes. A follow-up highlights funds with valuations older than your limit.