Net worth over time by entity
A stacked chart of net worth by entity, with the drivers called out.
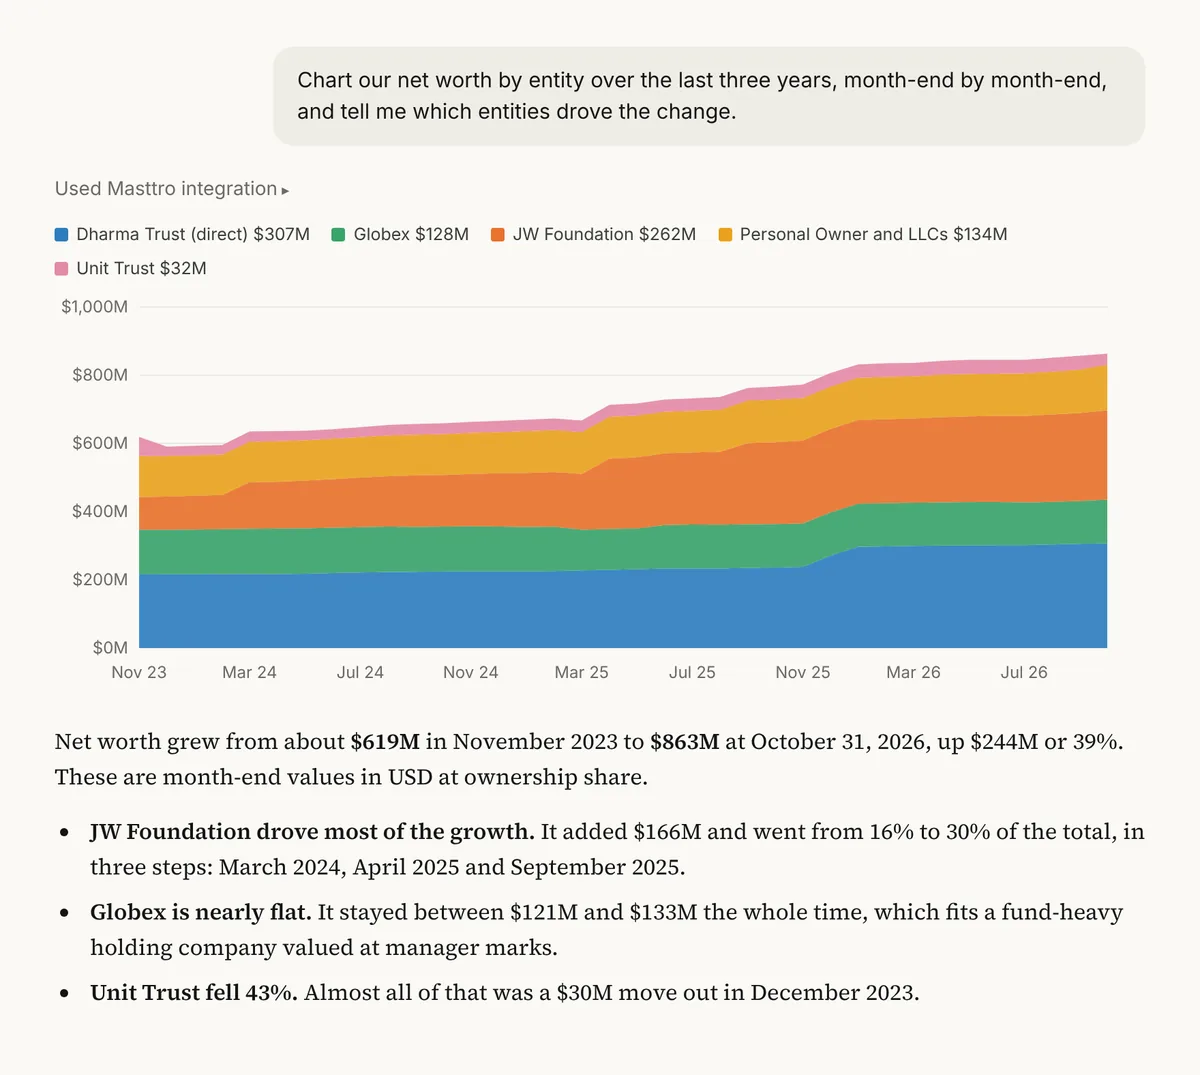
Chart our net worth by entity over the last [three] years, month-end by month-end, and tell me which entities drove the change.
Illustrative output based on Masttro's demo family office data.
Net worth at each month-end over the period, stacked by entity so you see both the total and its parts.
Each vehicle is counted at the family's share of it, so jointly held entities aren't overstated.
The answer names the entities that moved the total most, not just the shape of the line.
Replace [three] with the number of years you want to chart. Up to 36 month-ends are available.
Why look at net worth as a trend by entity?
A single month-end figure can hide a slow drift. One entity may be growing steadily while another is being drawn down to fund the family, and the total can look flat the whole time.
Charting each entity month by month shows when the mix changed and which part of the structure caused it. That is usually the conversation a principal or trustee wants to have, and it is hard to rebuild from spreadsheets.
Month-end values over years show trends a single report misses.
The chart keeps every vehicle visible inside the total.
Follow-ups switch the view to asset classes or isolate one entity.
Questions about this prompt
How far back can the chart go?
Up to 36 month-ends, so three years by default. Ask for fewer years by changing [three].
How are partly owned entities counted?
At ownership share. Holdings are rolled up to each investment vehicle at the family's percentage, which avoids counting the same asset twice.
Can I chart a single entity?
Yes. Use the follow-up that plots one entity on its own, and replace the bracketed name with the entity you want.
Is the chart interactive?
That depends on the AI tool. Claude can draw the chart in the conversation, and you can ask it to add filters or turn it into an interactive view.