Monte Carlo simulation
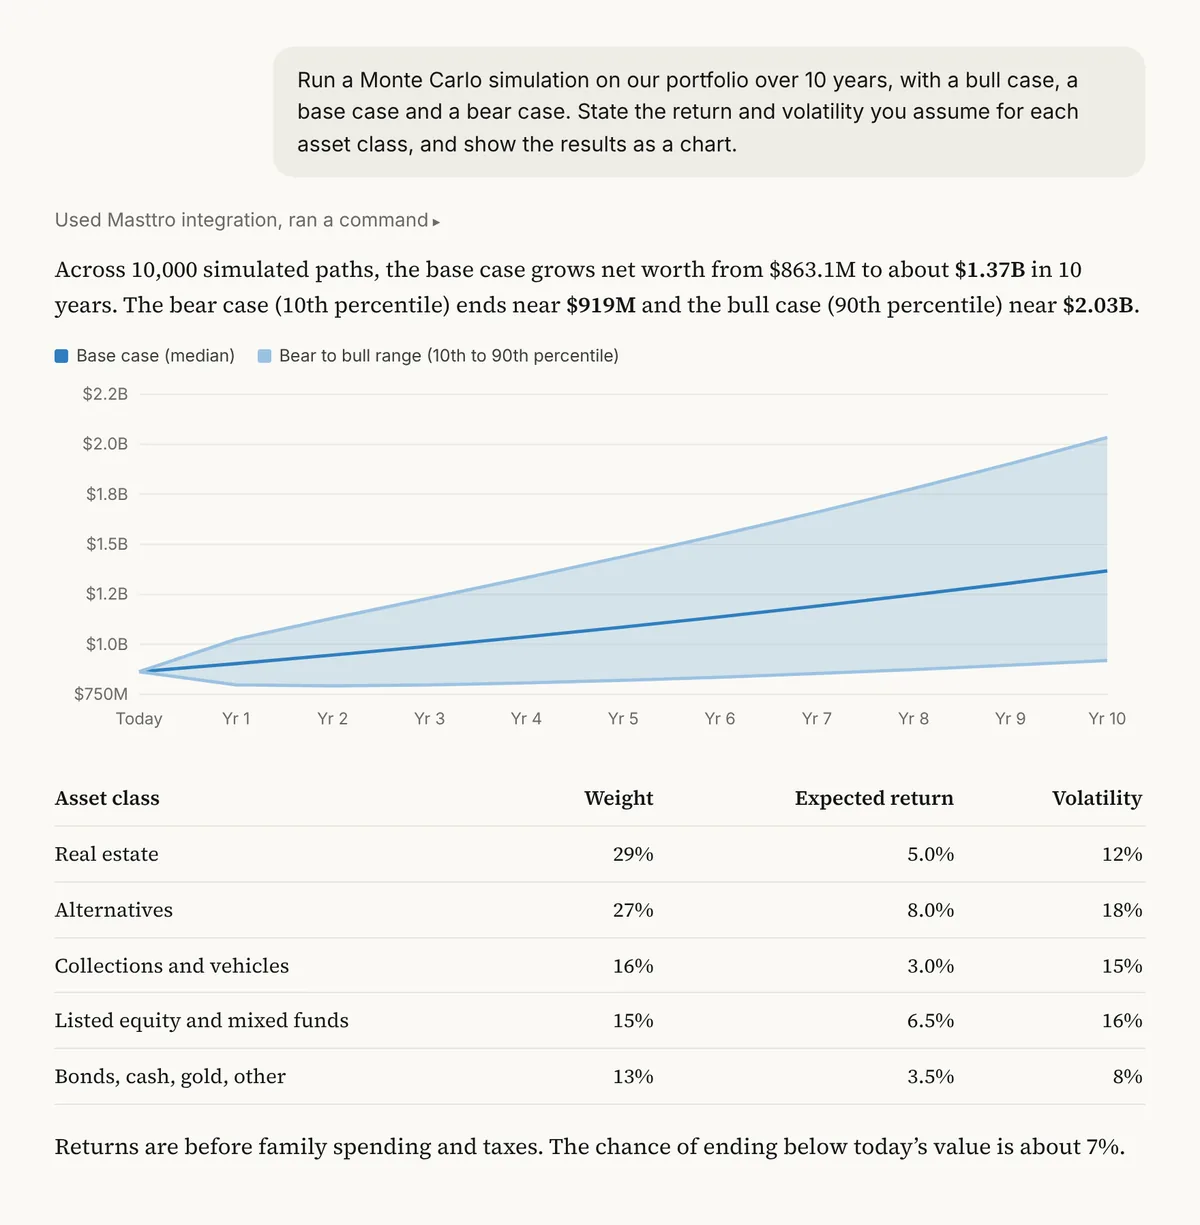
A 10-year range for net worth, with bull, base and bear paths.
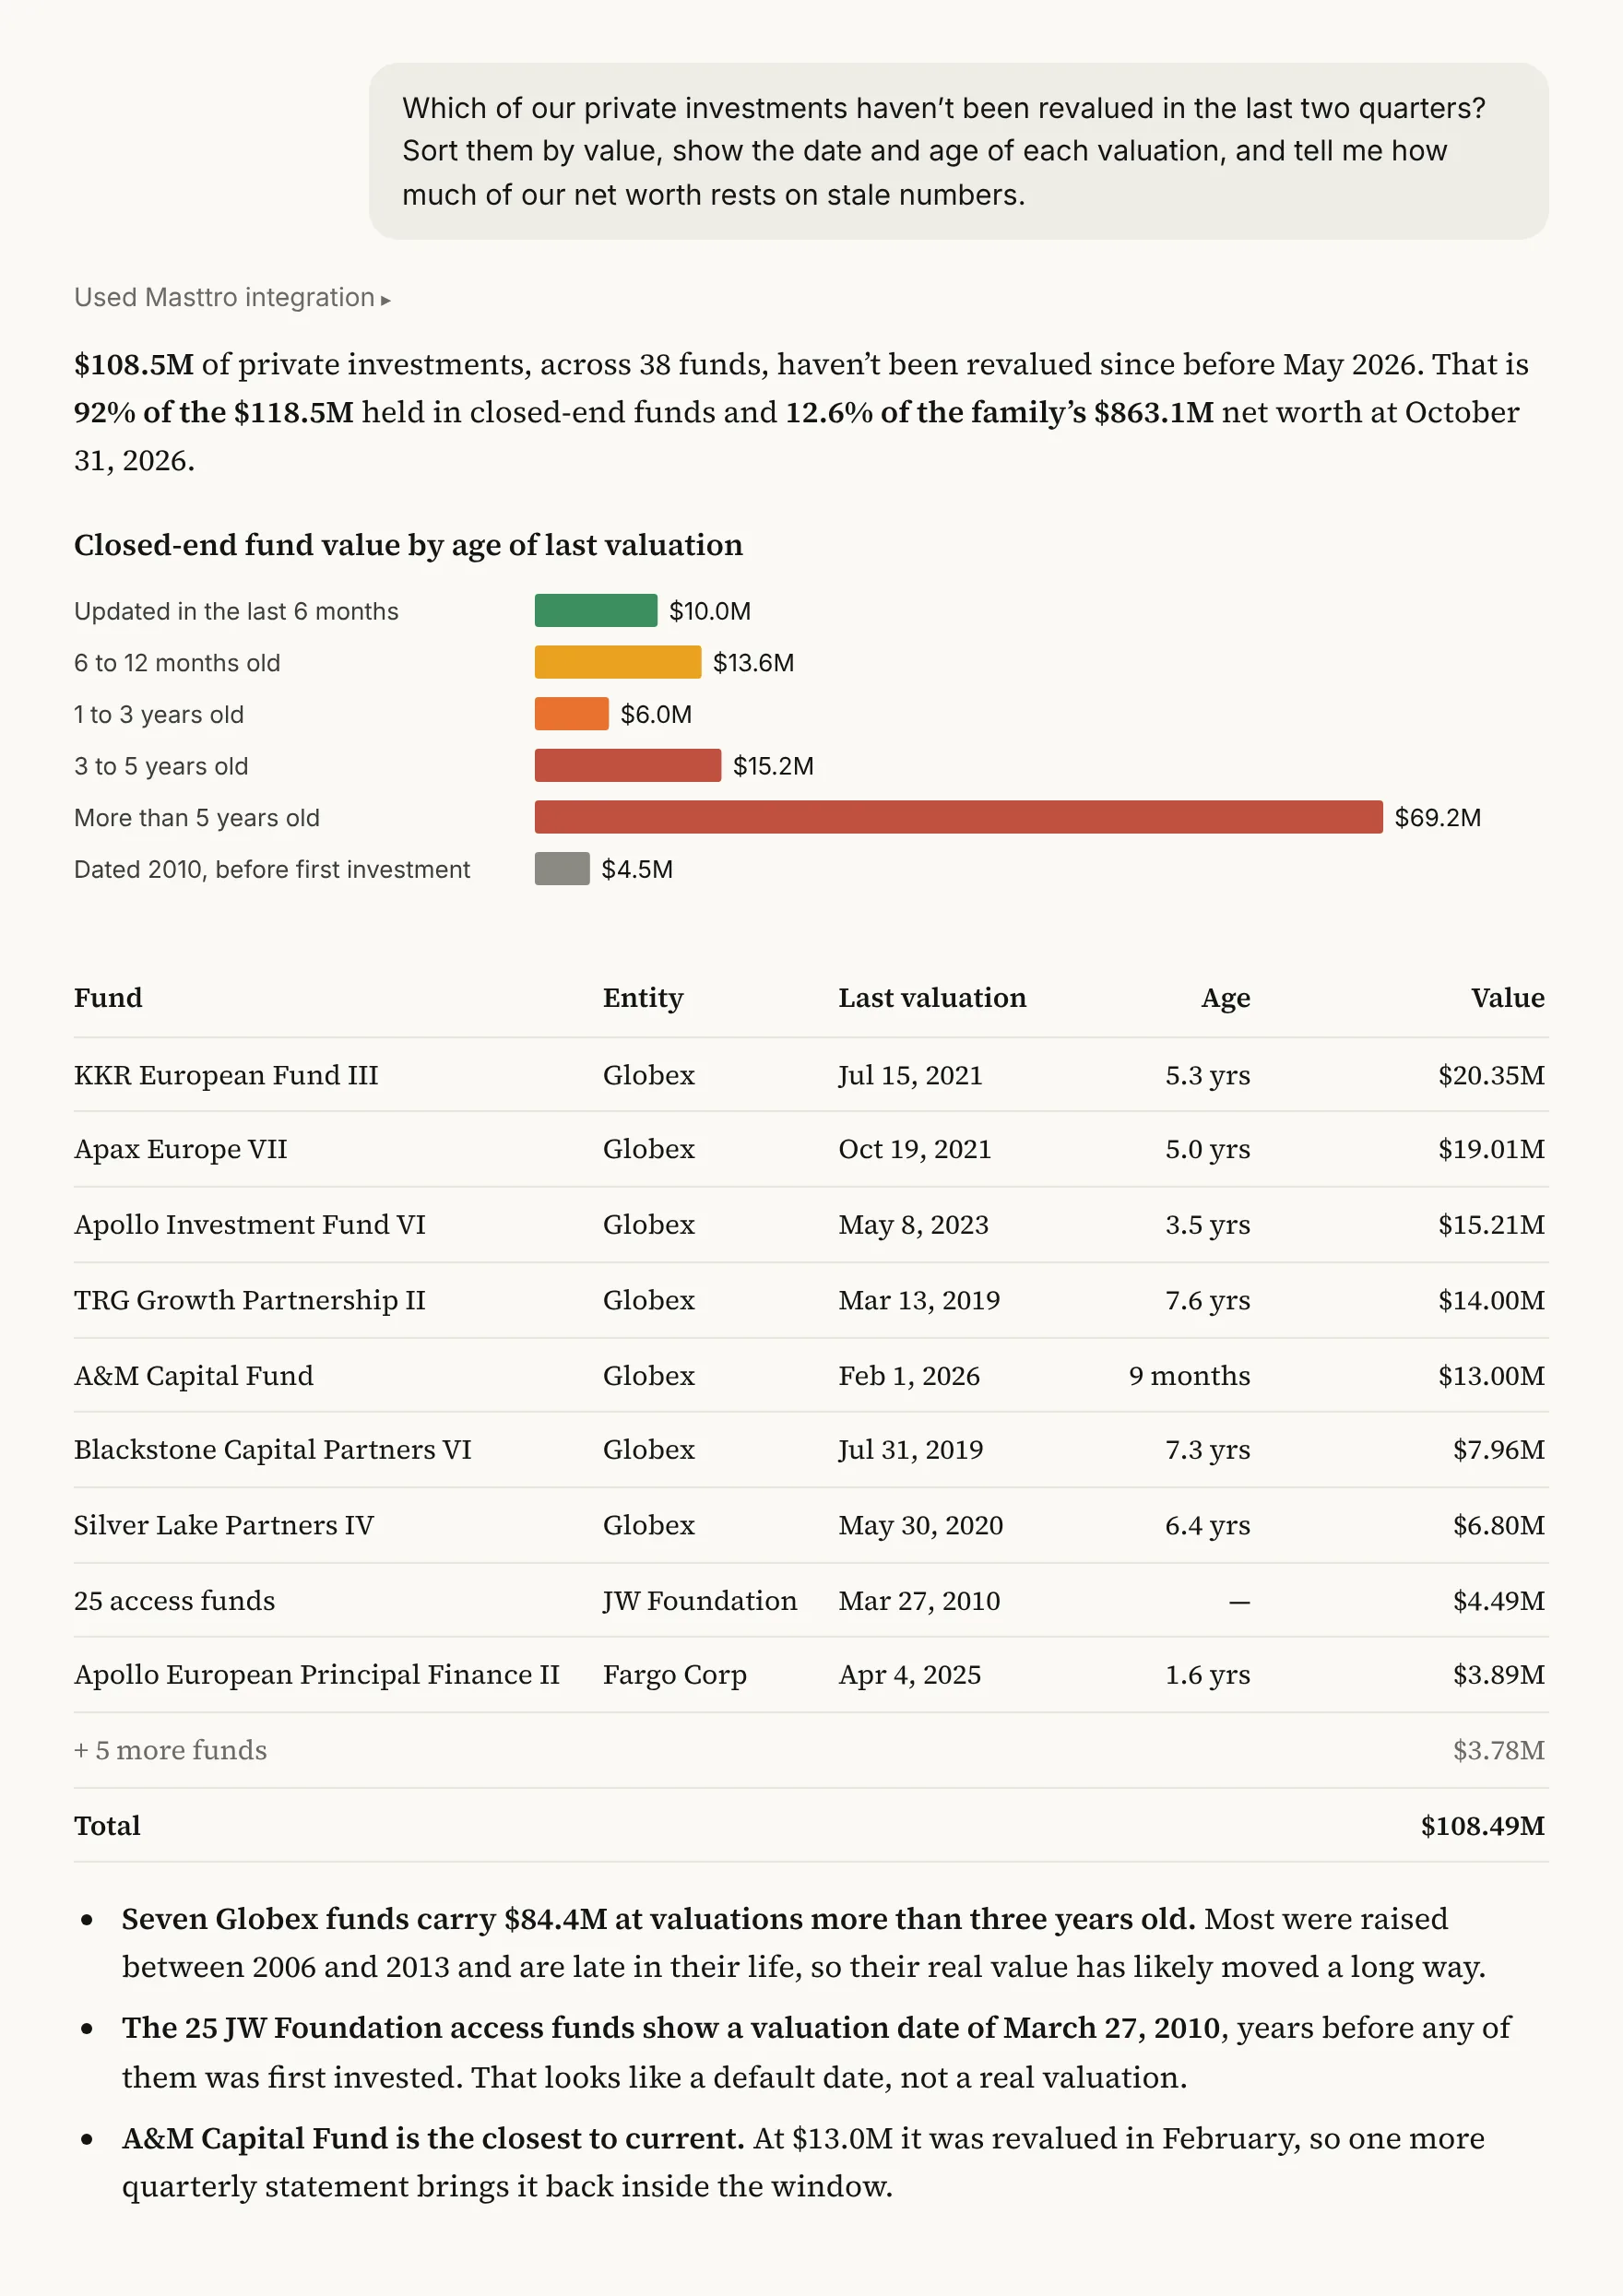
Run a Monte Carlo simulation on our portfolio over [10 years], with a bull case, a base case and a bear case. State the return and volatility you assume for each asset class, and show the results as a chart.
Illustrative output based on Masttro's demo family office data.
Thousands of simulated paths for net worth over the period.
Three cases shown on one chart.
Return and volatility for each asset class are listed.
Replace [10 years] with your planning horizon.
Why run a Monte Carlo simulation on the family portfolio?
A single projected return gives a false sense of certainty. Families planning across generations need to see the spread of outcomes, including the poor ones.
This prompt uses current holdings by asset class from Masttro and asks the AI to state its return and volatility assumptions before simulating. Adding spending with a follow-up shows whether the plan survives a bad decade.
Good, typical and poor outcomes on one chart.
Return and volatility inputs are stated and can be changed.
A follow-up adds annual family spending.
Questions about this prompt
Where do the return and volatility assumptions come from?
From the AI tool. Masttro supplies current holdings by asset class, and the prompt asks the AI to state the assumptions it used.
Can I include family spending?
Yes. The first follow-up adds an annual spending figure.
Can I see the chance of a loss?
Yes. A follow-up asks the probability that net worth is lower at the end of the period.
Is this a forecast?
No. It is a simulation based on stated assumptions. Change them to test other views.