Geographic exposure map
An interactive world map of where the family’s wealth is exposed.
Break down our holdings by geographic exposure at [month-end] and show it on an interactive world map, with a filter by asset class and the main holdings for each country on hover.
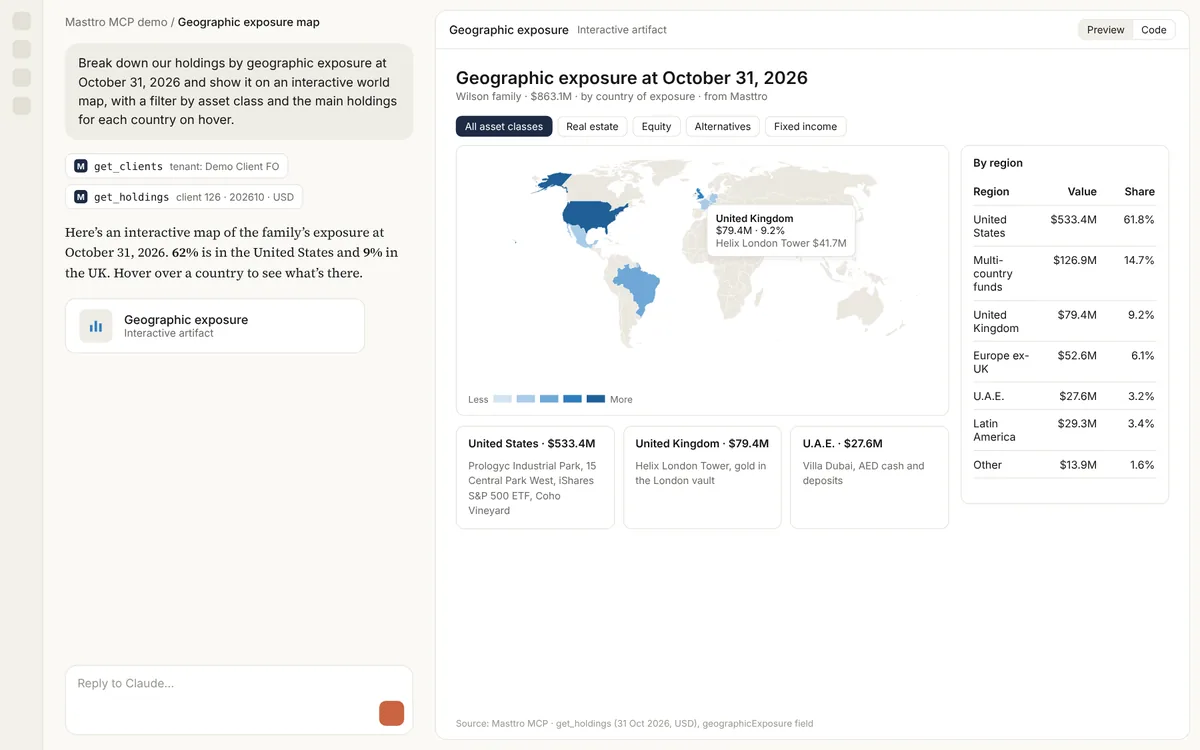
Illustrative output based on Masttro's demo family office data.
Holdings by geographic exposure, shaded by value.
Narrow the map to equities, real estate or any other class.
The main positions for each country.
Replace [month-end] with the date for the map.
Why see geographic exposure on a map?
Geographic exposure is hard to read in a table. A map shows at a glance where the family's wealth is concentrated and where it is absent.
This prompt has the AI build an interactive map from the geographic exposure recorded for each holding in Masttro, with filters and hover detail.
Concentration is obvious at a glance.
See which holdings drive each country.
A follow-up adds currency exposure.
Questions about this prompt
Where does the geographic data come from?
From the geographic exposure recorded for each position in Masttro.
Can I limit it to one asset class?
Yes. Use the filter, or the first follow-up for real estate only.
Can I add currency exposure?
Yes. A follow-up adds it as a second layer.
Which AI tools can build the map?
Claude can build interactive maps in the conversation. Results vary by tool.