Allocation versus selection
Return split into allocation and selection, with a scorecard for each manager.
Evaluate our portfolio’s performance over the past [three] years and work out how much of the return came from asset allocation versus manager selection. Calculate excess return against an appropriate benchmark, tracking error and information ratio for each manager, and tell me which managers added risk-adjusted value. State the benchmarks you used.
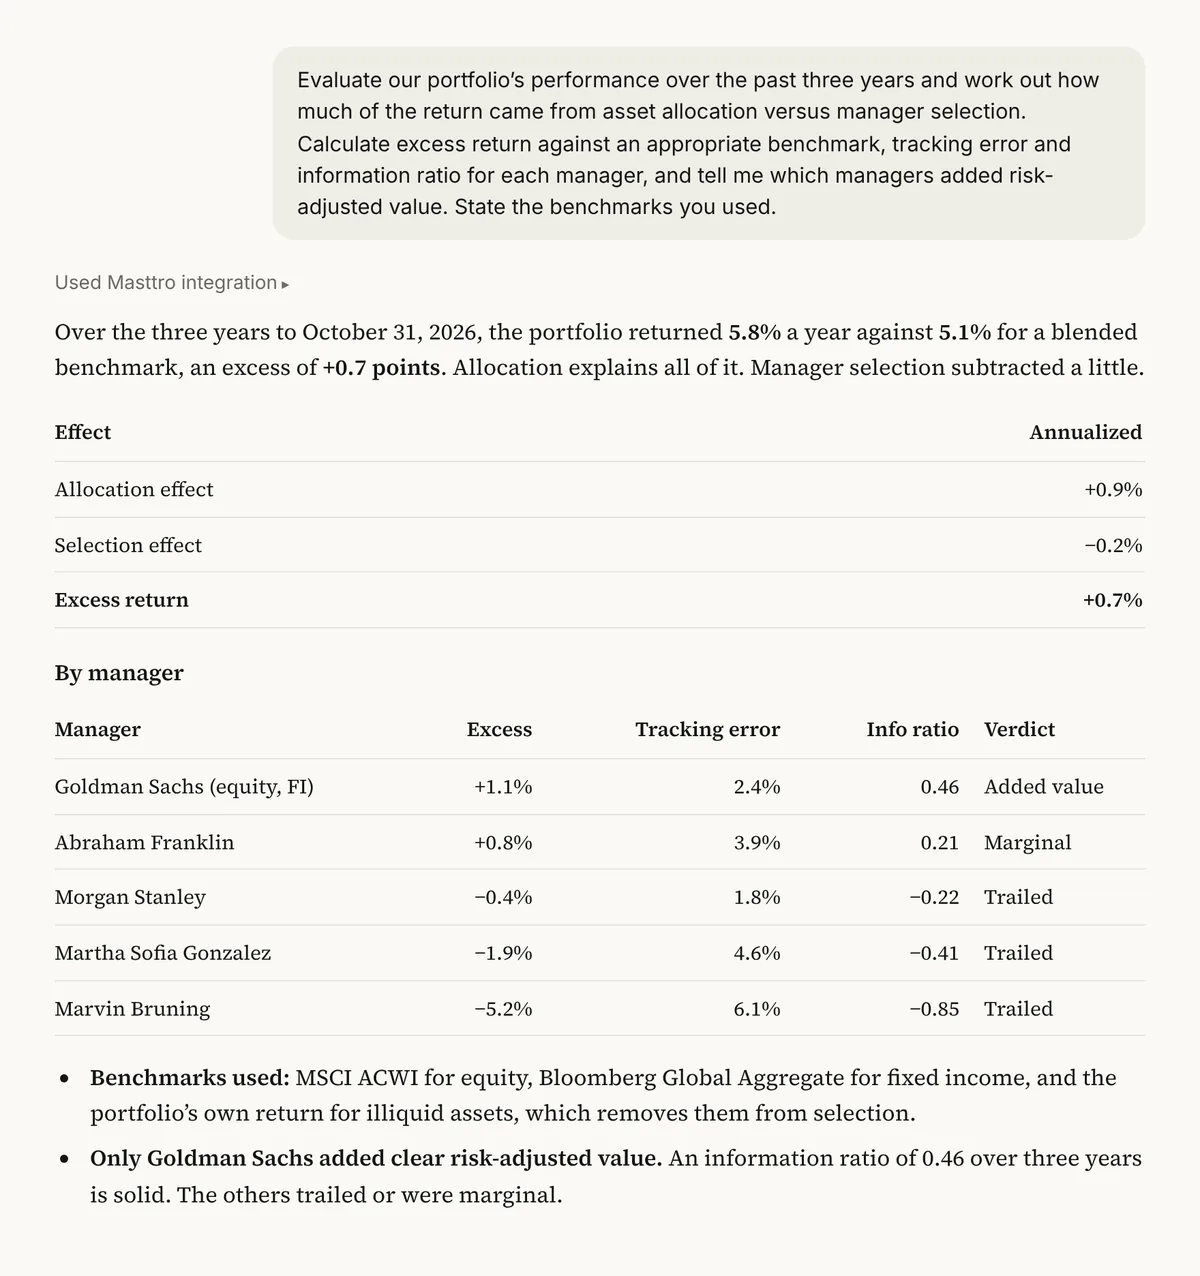
Illustrative output based on Masttro's demo family office data.
How much of the return came from the asset mix and how much from picking managers.
Excess return, tracking error and information ratio for each manager.
The answer names the benchmarks used, so you can challenge them.
Replace [three] with the number of years to evaluate.
Why split returns into allocation and selection?
Good results can come from being in the right asset classes or from choosing good managers inside them. Families pay very different fees for each, and it helps to know which one is working.
This prompt takes monthly returns by asset class and manager from Masttro and asks the AI to run the attribution and a risk-adjusted scorecard. Benchmarks come from the AI tool, since Masttro doesn't store them for this client, so the prompt asks it to state them.
Separates the asset mix from manager choice.
Tracking error and information ratio show who added value for the risk taken.
You can swap in your own benchmarks with a follow-up.
Questions about this prompt
Where do the benchmarks come from?
From the AI tool. Masttro supplies monthly returns by asset class and manager, and the prompt asks the AI to state the benchmarks it chose.
Can I use my own benchmarks?
Yes. The first follow-up names specific indices to use instead.
What is an information ratio?
Excess return over the benchmark divided by tracking error. Higher means a manager added more return for each unit of active risk.
Can I see attribution year by year?
Yes. A follow-up breaks the result down by year.