
Your investment records have become too complicated for a spreadsheet, and you can probably feel it. Government, municipal, and corporate bonds, all spread across different family entities and currencies, with someone still stitching them together by hand at the end of the month. Miss one payment date or use one out-of-date price, and the family could make a faulty decision based on numbers that were never accurate in the first place.
This guide covers where hand-built reporting falls apart, what a clear and trustworthy report actually needs, and how to fix the gap before bad numbers cost the family a good decision.
Key Takeaways
What Is Fixed Income Reporting for Family Offices?
Fixed income reporting for family offices is the consolidated measurement and disclosure of every interest-bearing instrument a family owns. Across entities, custodians, jurisdictions, and currencies, fixed income investments are inventoried alongside the cash flows, accruals, tax treatments, and risk exposures those instruments generate. Family offices currently allocate 15% of portfolios to fixed income on average (rising to 18% for offices below $100 million in AUM, according to UBS, 2025).
The 2022–2023 rate cycle made the stakes hard to ignore. The Bloomberg U.S. Aggregate Bond Index returned negative 13% in 2022. That was the worst calendar year in its 46-year history (Bloomberg, 2023). Family offices that didn’t move quickly to calculate duration exposure learned the cost in dollars.
Any fixed income report worth showing to a principal answers six questions at once:
- What do we own?
- What is it worth today?
- What cash does it produce?
- What tax does that cash trigger?
- What risk are we carrying?
- What changed since last quarter?
Producing a report that answers these questions inside a single legal entity is straightforward. Producing it across a family’s entire structure (including onshore and offshore trusts, operating LLCs, foundations, SMA sleeves, and direct holdings) is where most family-office reporting actually fails.
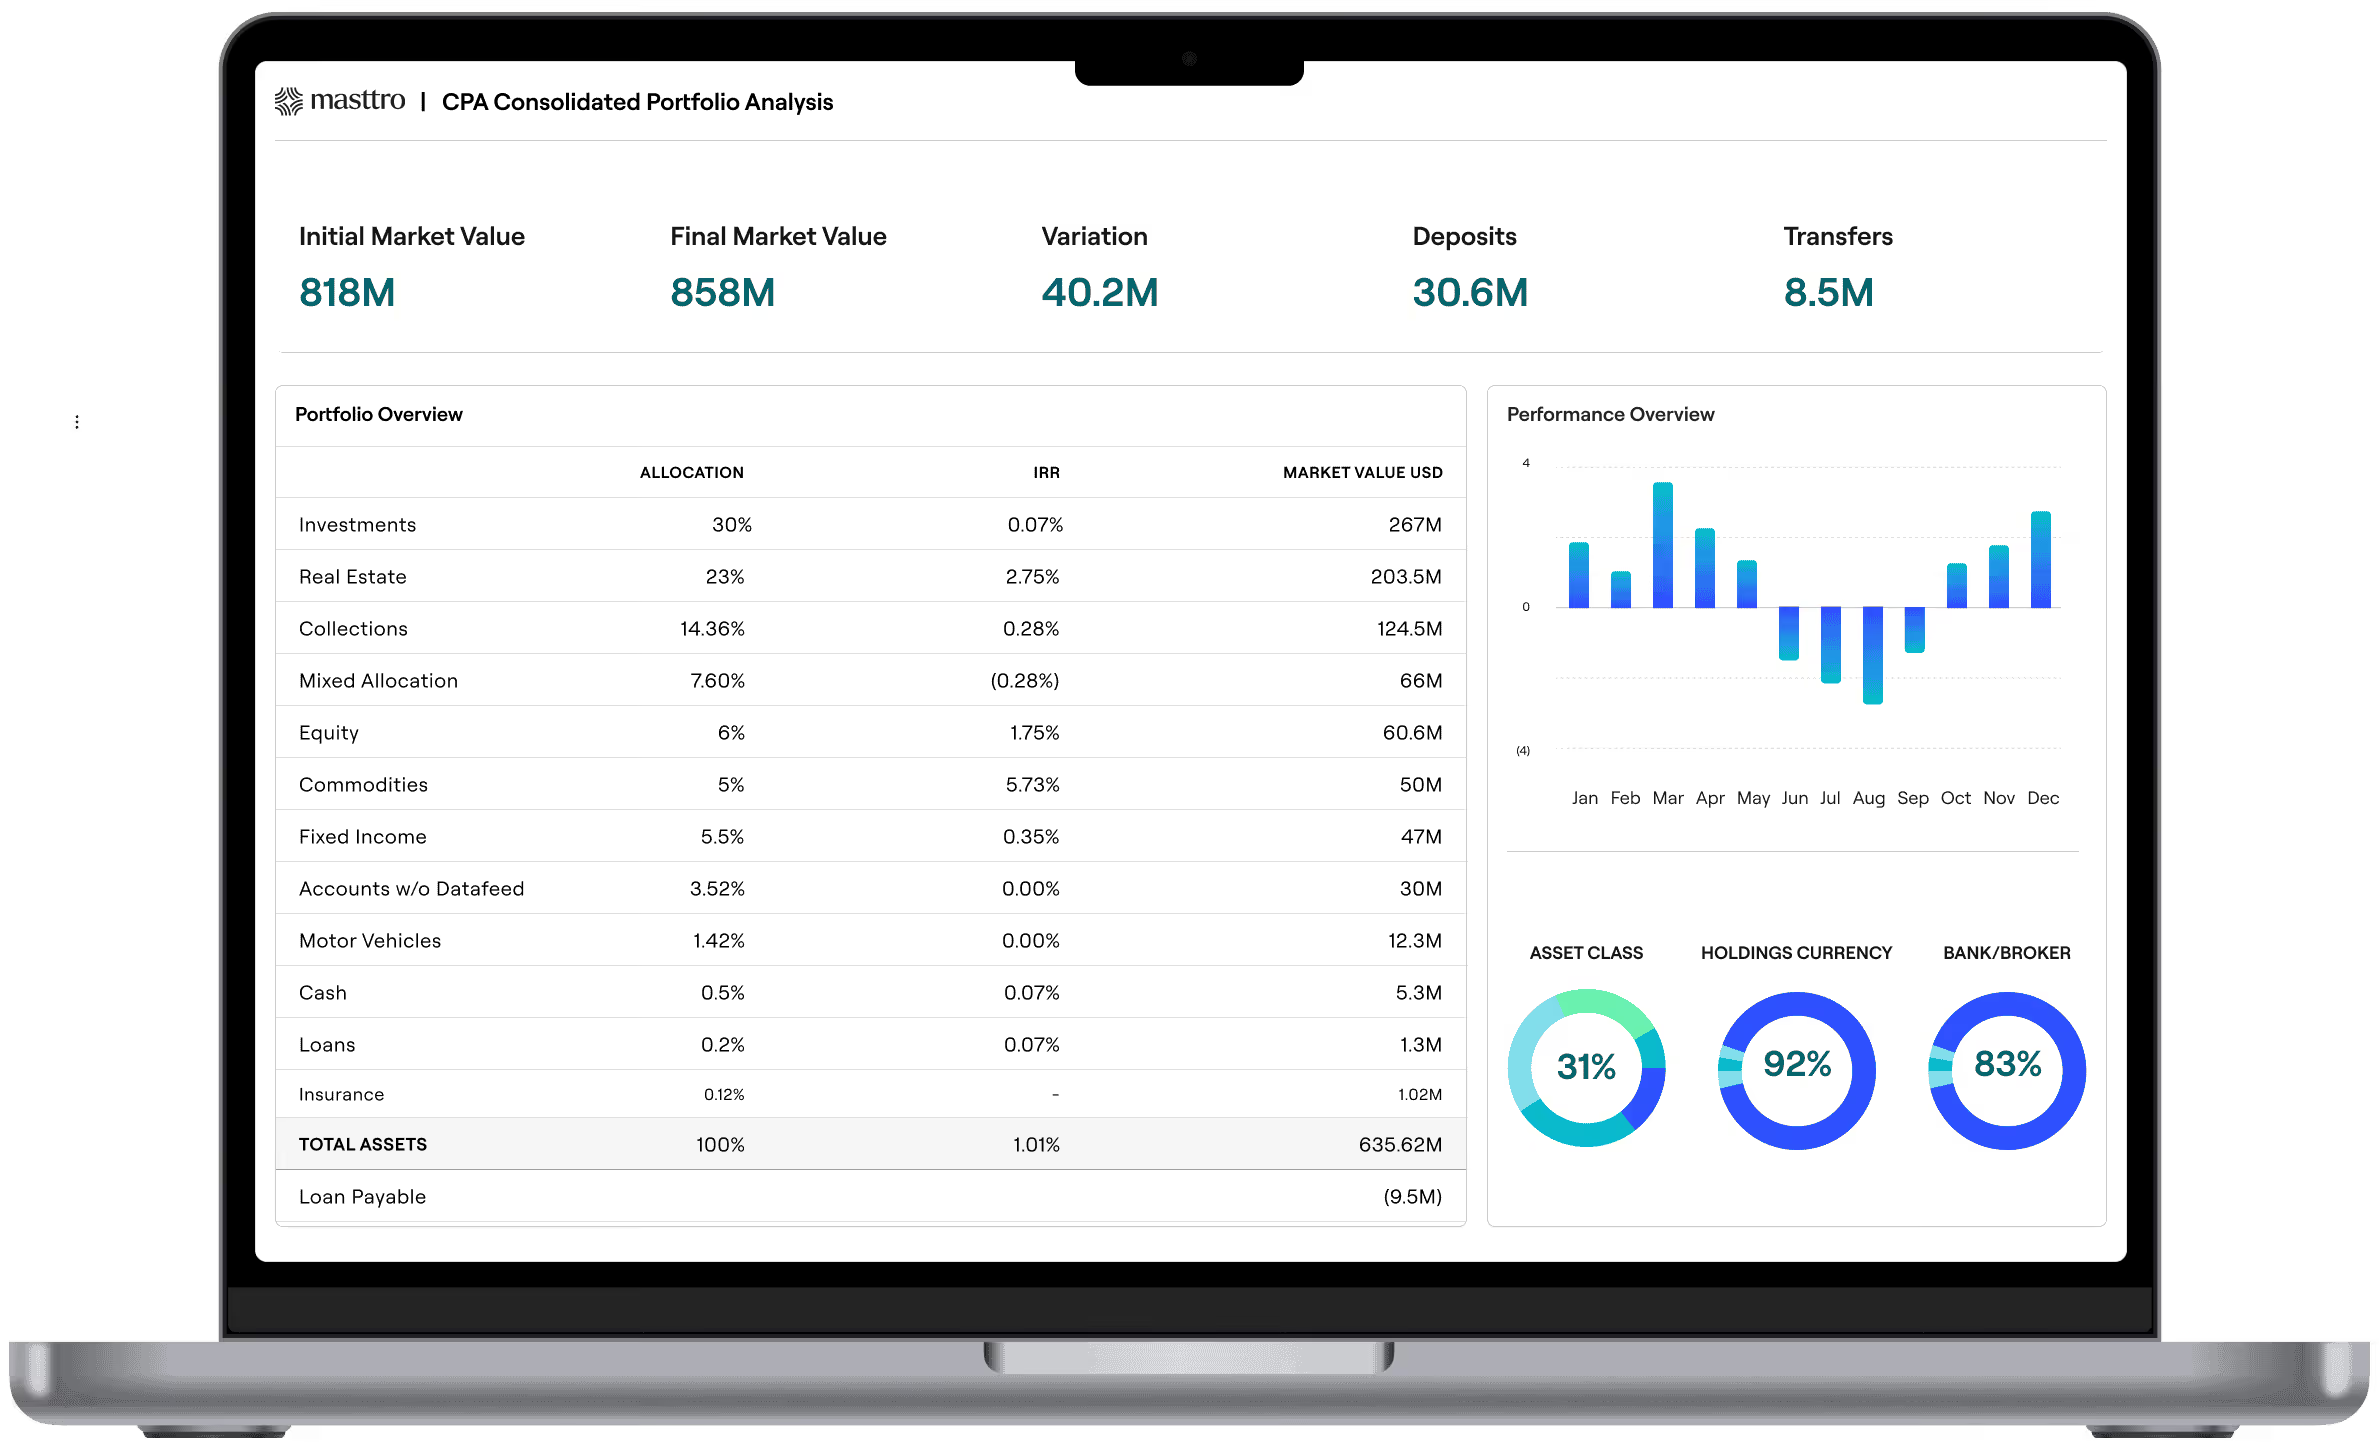
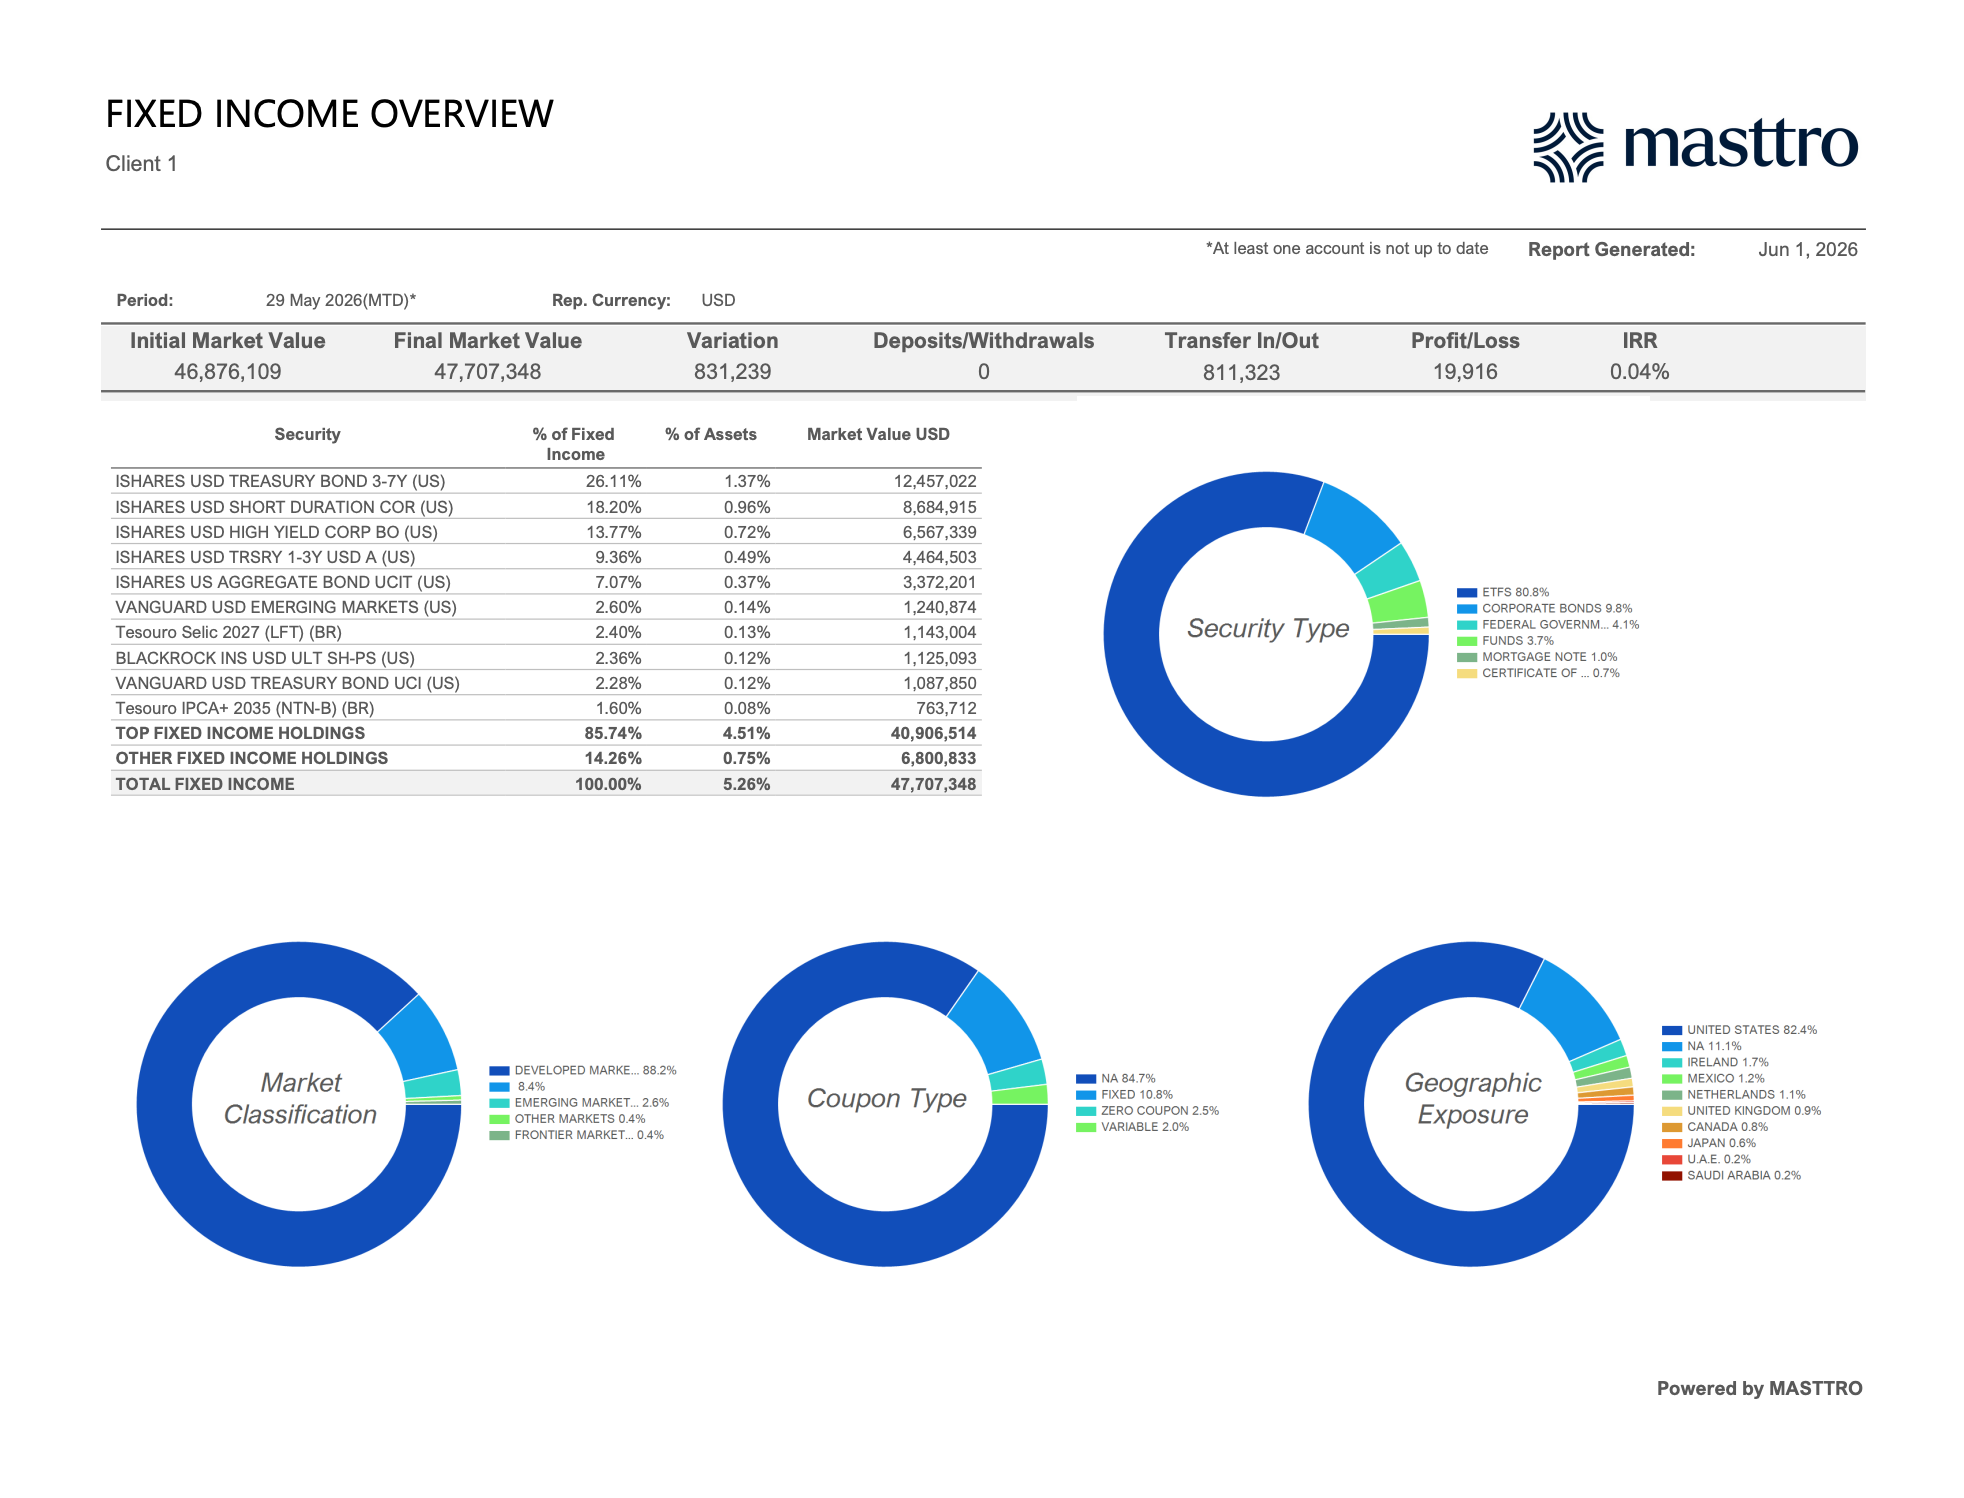
In Masttro, the page that answers those first questions is the Fixed Income Overview. It opens with a single-row KPI strip that lists initial market value, final market value, variation, deposits/withdrawals, transfer in/out, profit/loss, and IRR. This immediately tells the principal what the book did during the period, in cash terms.
Below that, a top-holdings table shows concentration. In one of our test instances, for example, the top 10 holdings make up 85.74% of the $47.7M fixed income book, with 80.8% sitting in ETFs and the remainder in corporate bonds, federal government paper, and mortgage notes. The four donut charts correspond to security type, market classification, coupon type, and geographic exposure.
For context on how this reporting layer sits alongside the rest of the book, see how Masttro handles global data aggregation for family offices and consolidated portfolio analysis.
Why Is Fixed Income Reporting More Complex Than Equity Reporting?
Equity reporting is essentially price times share count, with dividends as the only secondary feature most owners track.
Fixed income carries five additional layers of complexity. According to SIFMA (2025), more than 1 million distinct U.S. corporate bonds contain call provisions, sinking funds, or other embedded options that change how the instrument behaves in different rate environments.
Accrued interest, OID, and amortization
Coupons accrue daily, even when no cash has changed hands. Original issue discount (OID) and premium amortization adjust cost basis over the life of the bond, which means the “cost basis” a custodian shows on day one is not the cost basis used for tax reporting in year three. A family-office report that ignores accrual treatment will misstate both yield and after-tax return.
Callable, puttable, and structured features
A 4.5% bond callable next year is not the same instrument as a 4.5% bond with ten years of certain coupons. Yield-to-worst, option-adjusted spread (OAS), and effective duration all need to live in the report alongside stated yield and stated maturity. Structured notes add further wrinkles: principal protection levels, knock-in barriers, and issuer credit overlays.
Credit ratings and migration
Two BBB bonds priced at par can carry materially different default risk. A complete report tracks par-weighted rating distribution, single-issuer concentration, sector exposure, and rating migrations since the last reporting period. A downgrade from BBB- to BB+ is the single most expensive event a fixed income manager can miss.
Tax-exempt vs. taxable
Munis, Treasuries, corporates, and foreign-source coupon income are each taxed differently. They are also taxed differently depending on the holding entity (non-grantor trust vs. private foundation vs. offshore PIC.). After-tax yield is the only number that matters to a principal, and producing it cleanly requires the report to know the holder, the issuer, and the jurisdiction.
Currency
The moment a family’s bond book includes a Swiss franc-denominated structured note, a Singapore dollar fixed deposit, or an emerging-market sovereign in local currency, single-currency reporting can break. Returns now need to be decomposed into coupon, price change, and FX. The FX hedging overlays themselves also need to be reported on.
What Metrics Should a Fixed Income Report Cover?
A complete family-office fixed income report covers four metric families: yield, duration and convexity, credit quality and sector exposure, and the maturity ladder and cash-flow calendar.
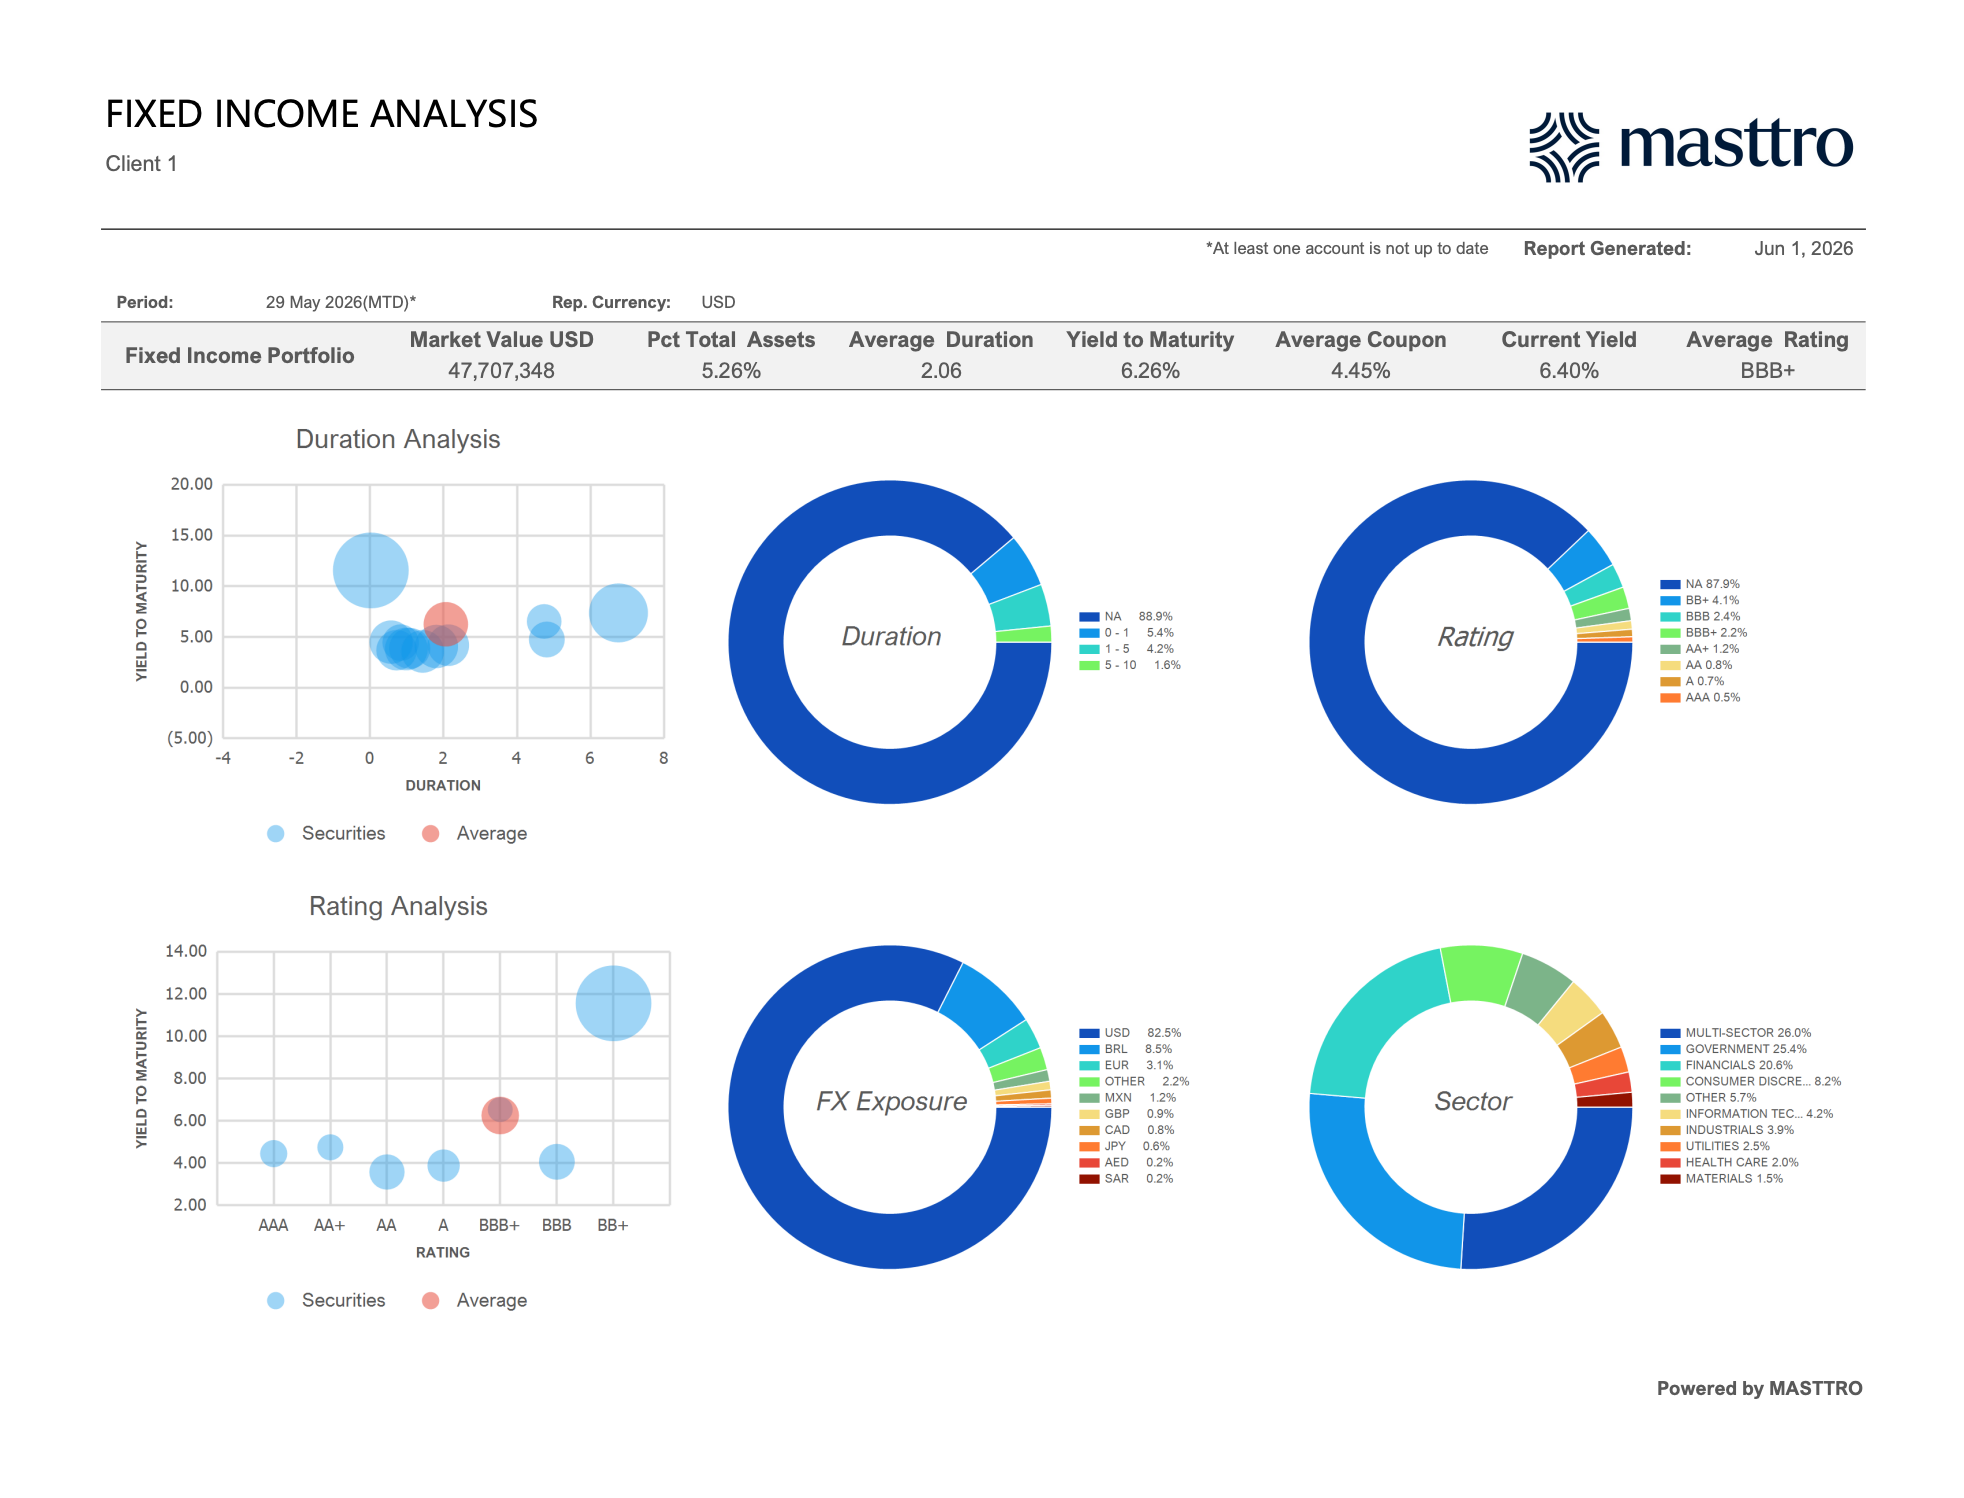
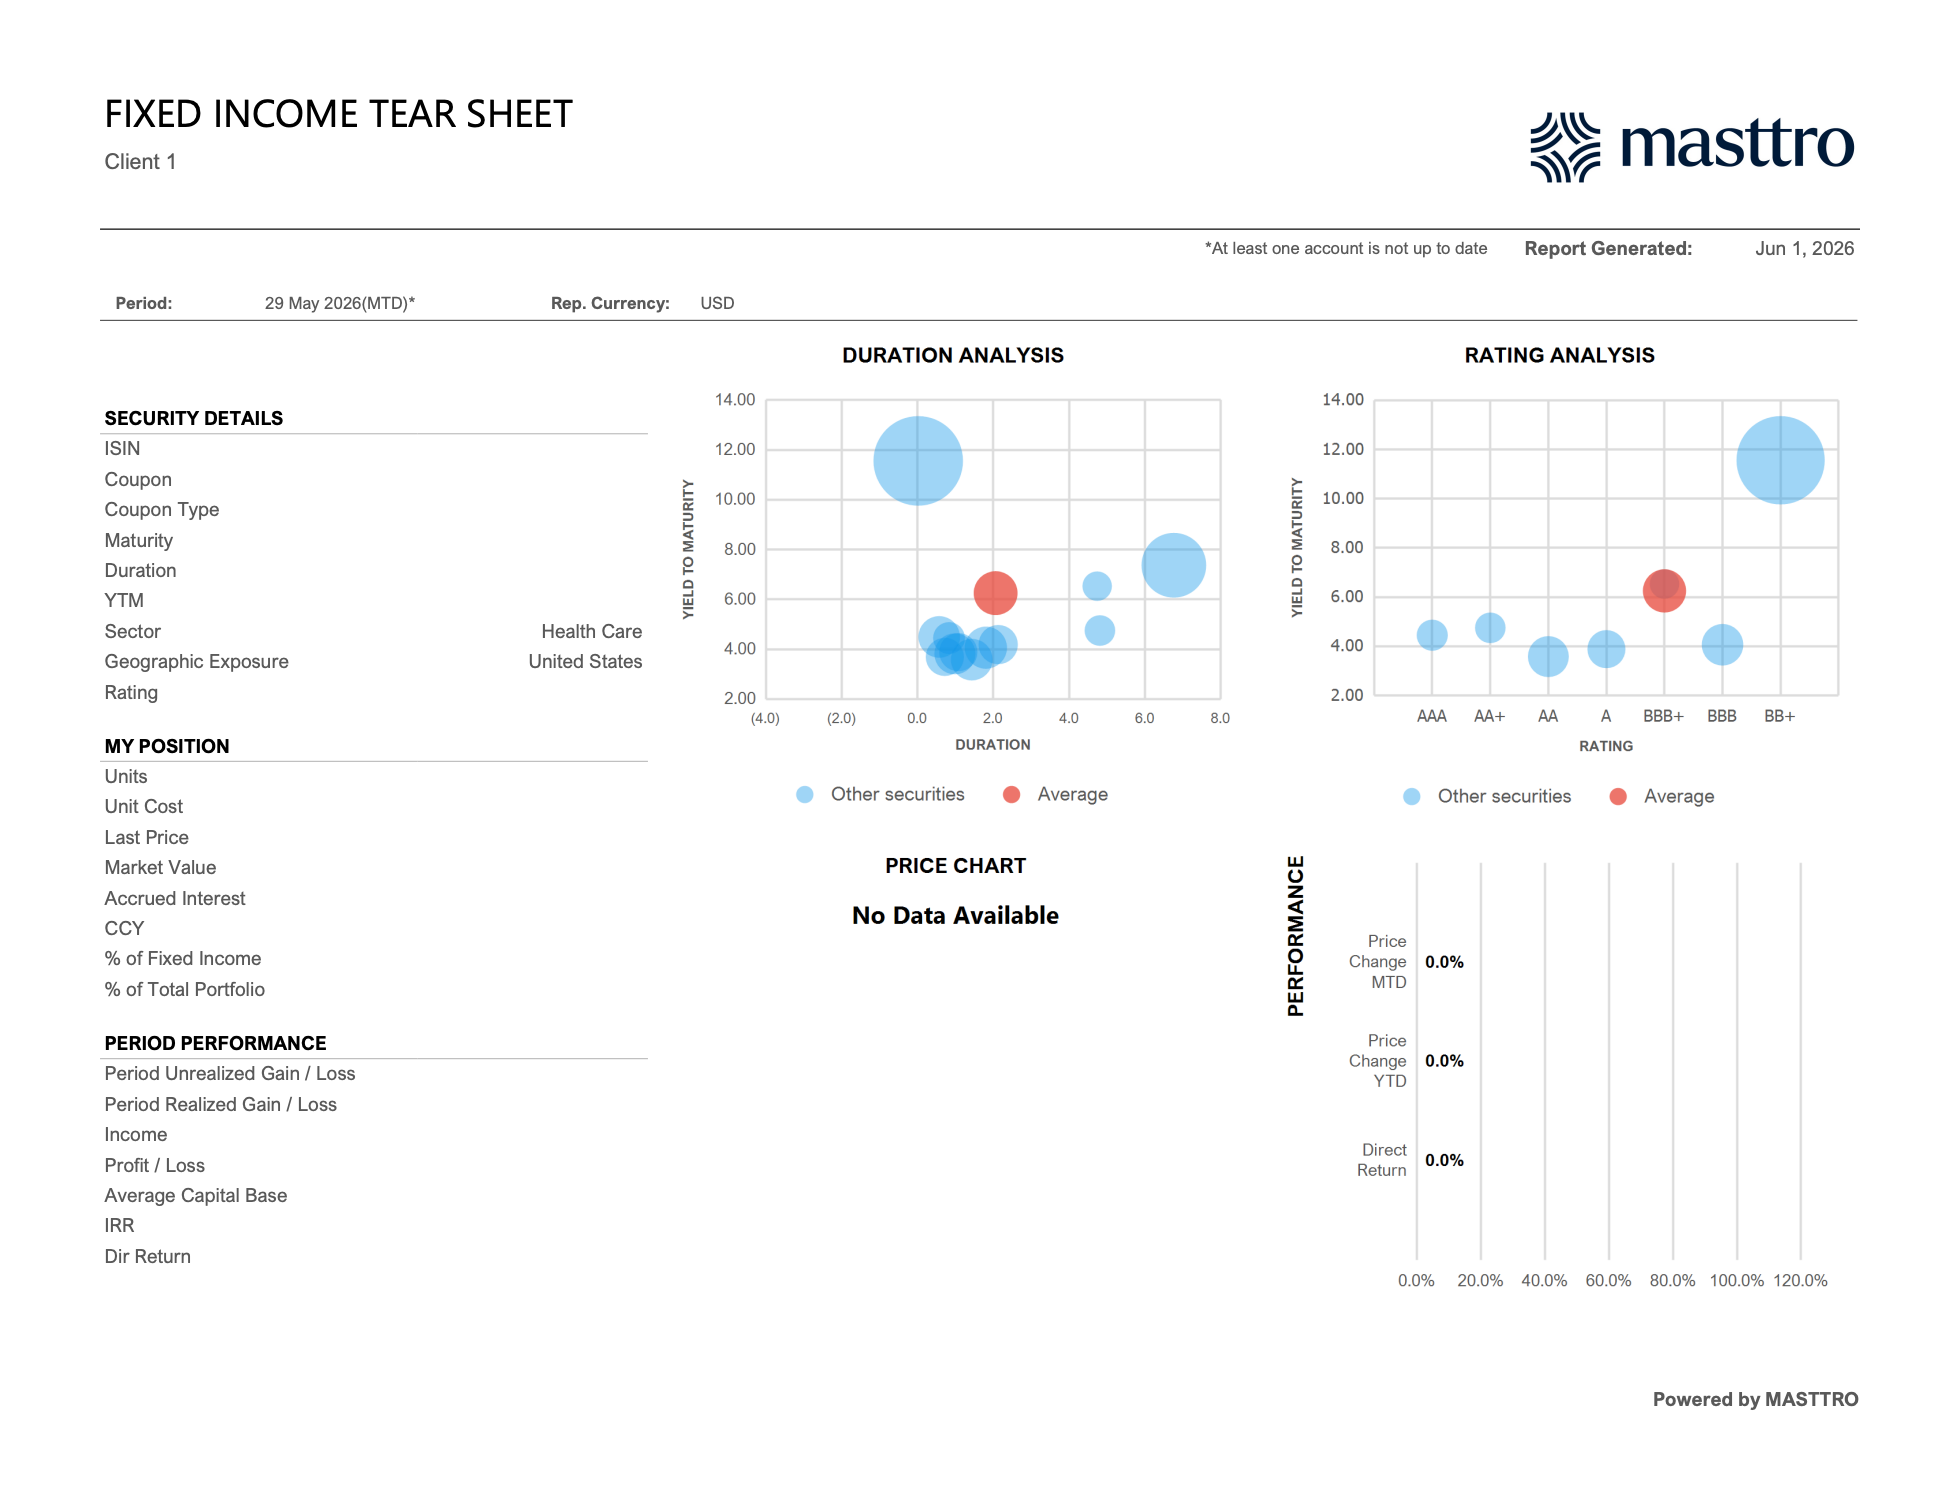
The Masttro Fixed Income Analysis view consolidates the four metric families onto one page. The KPI strip carries every headline number a principal asks for: market value, percent of total assets, average duration, yield to maturity, average coupon, current yield, and average rating.
In our demo view, that strip reads $47.7M / 5.26% of total assets / 2.06 average duration / 6.26% YTM / 4.45% average coupon / 6.40% current yield / BBB+ average rating. Beneath the KPI strip, two bubble charts (Duration Analysis and Rating Analysis) plot each holding by yield against duration and against rating, with the portfolio average overlaid in red. The four donut charts on the right (Duration, Rating, FX Exposure, Sector) let the principal isolate the dimension that prompted the question.
Yield metrics
Stated yield is not enough. The report should carry current yield, yield-to-maturity (YTM), yield-to-worst (YTW), and after-tax yield by entity. For private credit and floating-rate instruments, IRR replaces YTM. The point of having all four on the page is that they tell different stories: YTM assumes everything goes to plan; YTW prices in the worst-case call; after-tax tells the principal what the family actually keeps.
Duration and convexity
Macaulay, modified, and effective duration each have their place. But for reporting purposes, effective duration is the only one that handles callable and structured bonds adequately. Convexity matters when rate moves get larger than 50 basis points. A report that shows only modified duration on a callable book will understate interest-rate risk every time rates fall.
Credit quality and sector
Par-weighted rating distribution, single-issuer concentration limits (most family offices set a 3–5% cap per issuer), sector exposure vs. a chosen benchmark, and a watchlist of issuers within one notch of investment-grade.
Maturity ladder and cash flow
A 12- or 24-month rolling cash-flow projection (coupon plus principal) is what makes a fixed income report useful for liquidity planning. It’s also what allows the family office to answer the most common principal question on a bond book: “How much cash is this going to throw off next year?”
How Do Family Offices Structure Bond Ladders and Barbell Strategies?
Most family offices run at least part of their fixed income book internally rather than outsourcing to an SMA. According to Goldman Sachs (2025), 64% of family offices manage at least part of their fixed income internally. The vast majority of those internal books use one of three structures: a ladder, a barbell, or a bullet.
Laddering
A bond ladder spaces maturities evenly across a chosen horizon. For example, $1 million maturing each year from 2027 through 2036. The ladder smooths reinvestment risk: in any given year, only one rung rolls off, so the family never reinvests the entire book at the bottom of a rate cycle. Ladders are the default for families optimizing for predictable cash flow rather than total return.
Barbell
A barbell pairs short-dated bonds (1–3 years) with long-dated bonds (10–30 years) and avoids the middle of the curve. The structure outperforms a ladder when the yield curve steepens and underperforms when it flattens. Family offices use barbells to express a view on the shape of the curve without making explicit duration bets.
Bullet
A bullet concentrates maturities around a single target date — typically tied to a known future liability (a trust distribution, a foundation grant cycle, a business sale-related tax payment). The structure is unusual outside of liability-driven contexts but indispensable when one exists.
Immunization
Immunization matches portfolio duration to the duration of a future liability so the portfolio’s value is largely insensitive to small parallel rate moves. It is a more technical version of a bullet and shows up most often in family-office reporting for charitable trusts and large defined-benefit obligations carried inside operating businesses.
How Do You Measure Credit and Duration Risk in a Bond Portfolio?
Duration tells you how much value the portfolio loses per 1% rate move; credit tells you how much value it loses if issuers deteriorate.
According to PIMCO (2024), every 1% increase in rates produces roughly a 6% to 8% mark-to-market loss in a typical investment-grade portfolio with a duration of 6 to 8 years. That single number is the most important risk figure on a fixed income report, as well as the easiest to misrepresent if the underlying instruments include callables, floaters, or structured paper.
Key rate duration
A single duration number assumes the entire yield curve moves in parallel, which is rare. Key rate duration decomposes the portfolio’s interest-rate sensitivity by maturity bucket (2-year, 5-year, 10-year, 30-year), which is how a sophisticated report can reveal short duration exposure at the front of the curve and long duration exposure at the back, even when the headline number looks neutral.
Spread duration
Spread duration measures sensitivity to changes in credit spreads rather than risk-free rates. A BB-rated corporate bond can carry a 4-year rate duration and a 6-year spread duration. In a credit-spread widening event, the spread duration (and not the rate duration) is what determines mark-to-market. Most off-the-shelf custodian reports omit spread duration entirely.
Downgrade and default probability
Family offices should track exposure to bonds within one notch of the investment-grade boundary (BBB-/Baa3), since a downgrade from there to high yield triggers forced selling at institutional clients, and therefore meaningful price pressure. The speculative-grade default rate ended 2024 at 4.6%, above its long-term average of 4.1% (Moody’s, 2024).
Scenario analysis
Three scenarios belong on every quarterly fixed income report: a parallel +100 bp rate shock, a -100 bp shock, and a credit-spread widening of 150 bp. The scenarios let the principal see, in dollar terms, how the bond book is positioned for the regime change everyone is worried about.
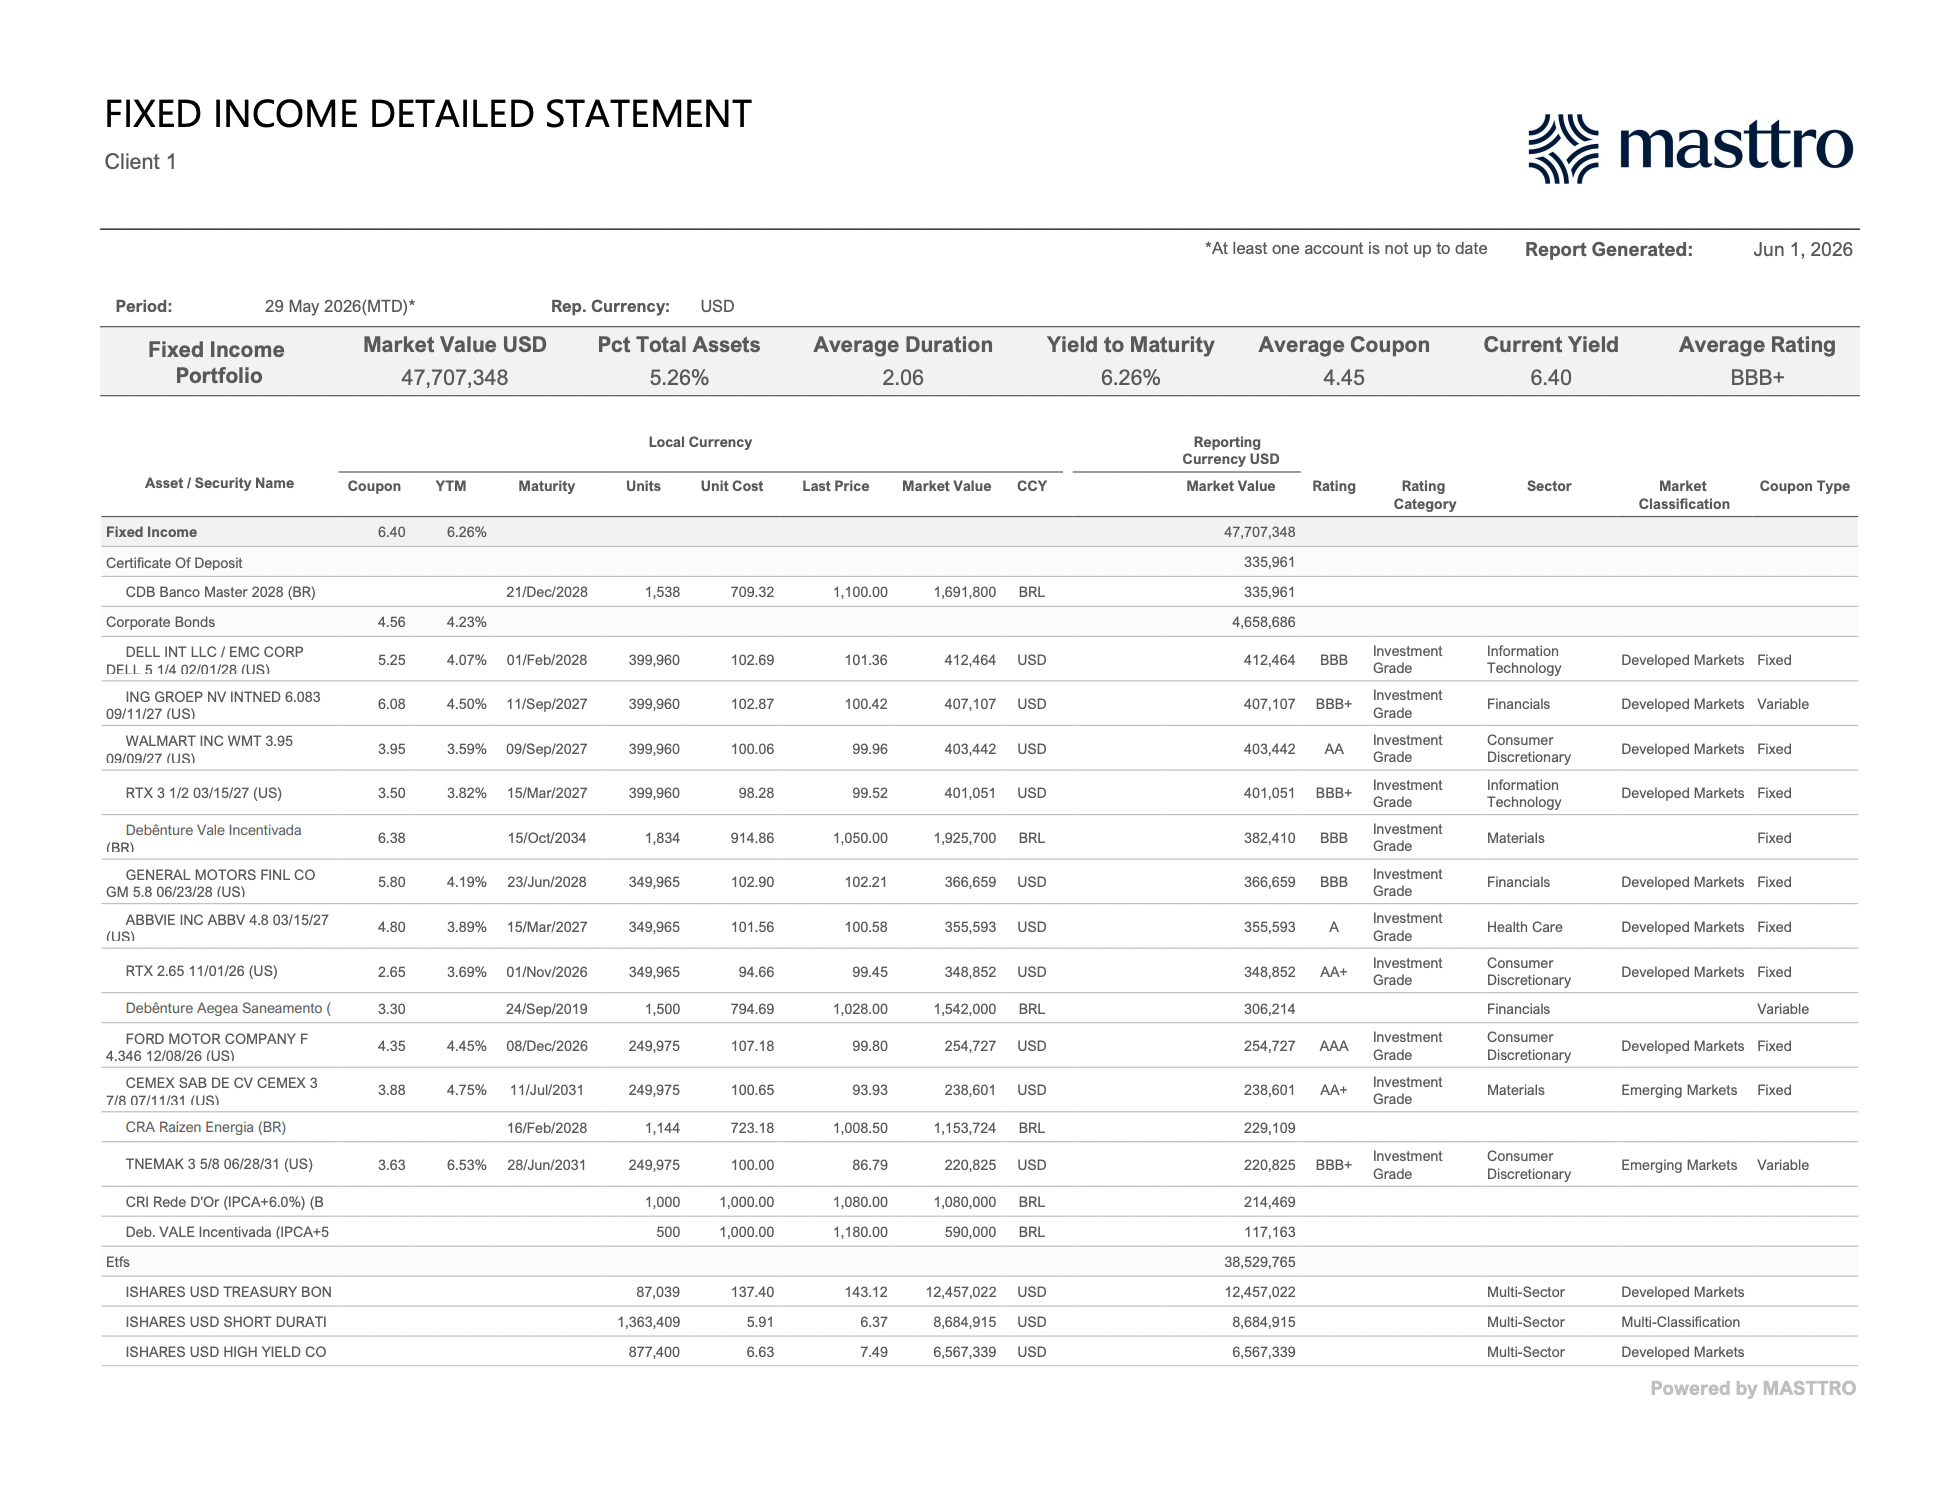
What the line-item view should show
The metrics page is the summary. The reckoning itself happens on the Fixed Income Detailed Statement, where every position is listed individually with coupon, YTM, maturity, units, unit cost, last price, market value in local and reporting currency, rating, rating category (investment grade vs. high yield), sector, market classification (developed vs. emerging), and coupon type (fixed, variable, zero coupon). Page two of the same statement adds accrued interest, total market value (clean + accrued), and gain/loss in reporting currency.
In our demo view, the line-item statement makes the multi-currency reality concrete: investment-grade U.S. corporates (DELL, WALMART, RTX, GM, ABBVIE, FORD) sit alongside BRL-denominated debentures (Vale Incentivada, Aegea, Raízen) and CDB Banco Master, with each line carrying its own coupon, accrued interest, and rating category. Total accrued interest across corporate bonds in this view is $45,446, with realized gain/loss of +$19,916 for the period.
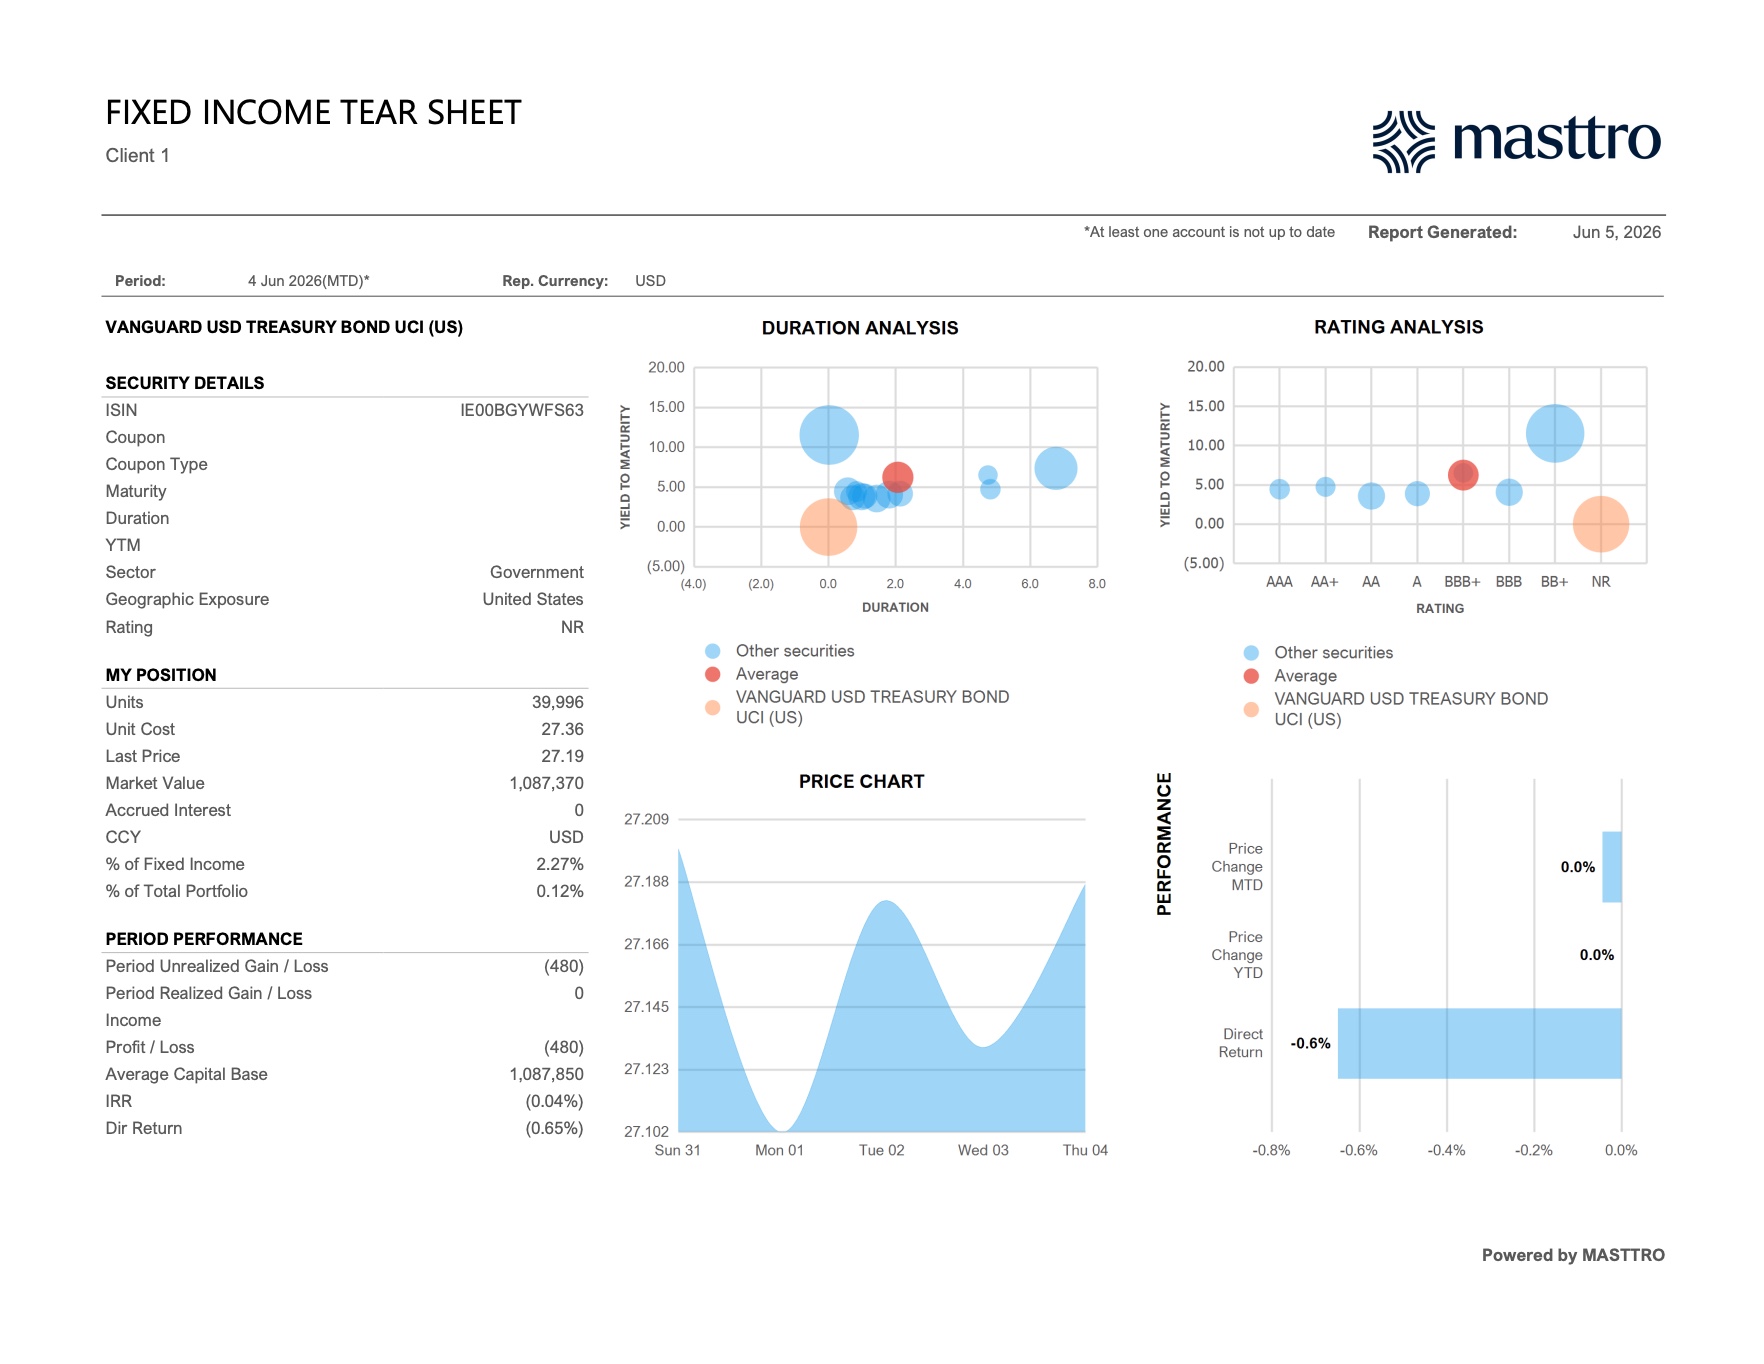
For any individual position, the Fixed Income Tear Sheet is the drill-down. The tear sheet collapses one bond’s security details (ISIN, coupon, coupon type, maturity, duration, YTM, sector, geographic exposure, rating), the family’s position economics (units, unit cost, last price, market value, accrued interest, percentage of fixed income, percentage of total portfolio), and period performance (unrealized G/L, realized G/L, income, profit/loss, average capital base, IRR, direct return) onto a single page. This information sits alongside the same duration and rating bubble charts re-anchored on the position in question.
How Should You Handle Muni Bonds and Tax-Equivalent Yield Reporting?
For U.S. families, munis remain the most common single tax-advantaged asset class. The U.S. muni market totaled $4.2 trillion in outstanding debt at end-2024, with individual investors and SMA portfolios holding the majority of it (SIFMA, 2025). For UHNW families, the muni line items on a bond report carry the heaviest after-tax math.
The tax-equivalent yield calculation
Tax-equivalent yield (TEY) is calculated as muni yield divided by (1 − the investor’s marginal tax rate). The principal-facing number is not the 4% coupon. It’s the equivalent taxable yield required to deliver the same after-tax dollar. For a top-bracket California resident at a combined 54% federal-plus-state rate, a 4% in-state muni delivers an 8.7% TEY. The report should show both numbers side by side.
State-specific treatment
In-state munis are typically exempt from state tax as well as federal. Out-of-state munis are not. A New York-domiciled trust holding California GO bonds picks up the federal exemption, but pays New York state tax on the coupon. A consolidated report that does not know the holder’s tax domicile will systematically overstate after-tax yield on out-of-state munis.
De minimis and market discount
When a muni is bought at a discount of more than 0.25% per year remaining to maturity, the discount is taxed as ordinary income rather than capital gain at maturity, under the so-called de minimis rule. For UHNW families buying secondary-market munis, this can swing the after-tax yield by 100 bp or more on a single position. A fixed income report needs to flag de minimis status at purchase, not at maturity.
For families with significant tax-sensitive allocations across multiple jurisdictions, look-through reporting becomes table stakes. See how Masttro’s consolidated portfolio analysis handles per-entity, per-jurisdiction tax overlays.
How Do You Report on Private Credit and Direct Lending?
Private credit is the fastest-growing fixed income category in family offices. Allocations doubled from 2% to 4% of portfolios between 2023 and 2024 (UBS, 2025), and the J.P. Morgan Family Office Report (2026) shows direct lending as the largest sub-strategy by AUM.
Why private credit reporting is different
Private credit is not really “fixed income” in the traditional public-bond sense. There is no liquid mark, no daily price, and no observable yield curve. Cash flows are irregular: capital calls, draw notices, paid-in-kind interest, fee accruals, and lumpy distributions. K-1s arrive on a 90- to 180-day lag. NAVs are reported T+45 to T+90. The reporting platform either handles these realities natively or the family ends up running parallel spreadsheets.
Key reporting components
A complete private credit section of a family-office report needs to show:
- Committed capital, called capital, and uncalled commitments per fund and per entity.
- NAV and unrealized P&L with NAV vintage date so the principal knows how stale the mark is.
- IRR and TVPI (since inception), not YTM.
- Cash distribution calendar: actual distributions received plus expected.
- K-1 status: received, reconciled, or outstanding, by holding entity and tax year.
Direct lending vs. fund investments
Direct loans (a family lending senior or mezzanine debt to an operating business, often as part of a co-investment or club deal) require an even higher reporting standard than fund commitments. They need loan-level data: amortization schedule, covenant status, collateral coverage, financial statement intake, and triggers for default.
A platform that treats direct loans as line-item alternatives without a sub-ledger will eventually surface a covenant breach late. We published a related breakdown in Alternative Asset Reporting: A New Standard For Family Offices and RIAs, which covers the same data architecture from the alternatives side.
How Is Technology Changing Fixed Income Reporting?
Family-office technology adoption is moving faster than any other operational area in the segment. Automated investment reporting adoption among family offices climbed from 46% in 2024 to 69% in 2025 (RBC/Campden Wealth, 2025). Fixed income, with its multi-source data dependency, is one of the largest drivers of this shift.
Real-time pricing and reference data
According to ICE Data Services (2024), evaluated prices cover more than 2.8 million fixed income instruments globally, with daily updates for actively quoted issues and end-of-day evaluations for thinly traded ones. Family-office platforms now connect directly to these feeds rather than relying on custodian statements, which can lag the market by several days on less-liquid issues.
AI-driven credit monitoring
Native AI is replacing manual rating-change surveillance. AI document pipelines now ingest issuer 10-Qs, rating-agency action releases, and indenture amendments and surface flagged exposures into the reporting platform without analyst intervention. The family office still makes the decision, but the AI removes the latency between event and notification.
Automated rebalancing
Bond-ladder maintenance, target-duration rebalancing, and concentration-limit enforcement can now run as rules inside the reporting platform. Today, AI can identify the drift, propose a trade, and route it for approval. This replaces the status quo of an analyst who pulls a custodian export into Excel each quarter.
What this means in practice
The reality is that technology is in the process of changing how reporting is done. T+3 NAVs are still T+3. K-1s still take 90 days. Trustee reporting cycles are still quarterly. What technology and automation actually deliver are fewer reconciliations, faster close, and a shorter distance between event and decision. It’s not magic, but it is meaningful for wealth owners and operators who care about efficiency and completeness of information.
That is the operational case for purpose-built family-office reporting platforms. For the broader context, see Masttro’s coverage of passion-asset reporting and the Saffery Trust webinar on secure visibility in financial reporting.
FAQs
What percentage of family-office assets are in fixed income?
Family offices allocate an average of 15% of total portfolios to fixed income, ranging from roughly 12% at the largest offices to 18% at smaller ones (UBS, 2025). High-grade developed-market bonds dominate, supplemented by 4% in private credit and smaller allocations to emerging-market debt and high yield (J.P. Morgan, 2026).
How do you calculate portfolio duration?
Portfolio duration is the weighted average of each bond’s effective duration, weighted by market value. A portfolio of equal $1 million positions in a 5-year duration bond and a 10-year duration bond has a portfolio duration of 7.5 years. According to PIMCO (2024), every 1% rate move produces roughly a 7.5% mark-to-market change for that portfolio.
What is the difference between IRR and YTM?
YTM is the yield assuming a bond is held to maturity with reinvestment at YTM — used for individual bonds with predictable fixed coupons. IRR is the money-weighted return on a private credit fund or direct loan with irregular cash flows, capital calls, and distributions. YTM works for standard fixed-coupon paper; IRR is required for any holding with variable timing.
What software do family offices use for bond reporting?
Family offices typically use multi-asset wealth platforms that integrate with custodian feeds and evaluated pricing services. Automated reporting adoption climbed from 46% to 69% between 2024 and 2025 (RBC/Campden Wealth, 2025). Platform choice depends on portfolio complexity: offices holding private credit, structured paper, or multi-jurisdiction munis need a system that handles both public bonds and illiquid loans natively, alongside the rest of the family balance sheet. Masttro’s own fixed income suite, for example, layers four views (Overview, Analysis, Detailed Statement, and Tear Sheet) onto the same consolidated data, so the period summary, the metrics page, the line-item reckoning, and the single-position drilldown all reconcile to the same source.
How are munis reported on a tax-equivalent basis?
Tax-equivalent yield (TEY) is calculated as muni yield divided by (1 − the investor’s marginal tax rate). For a top-bracket California resident at a combined 54% rate, a 4% in-state muni delivers an 8.7% TEY. The U.S. muni market totaled $4.2 trillion at end-2024 (SIFMA, 2025), and in-state versus out-of-state status materially affects after-tax returns.
How do you measure credit risk in a bond portfolio?
Credit risk is measured through par-weighted rating distribution, single-issuer concentration limits, sector exposure relative to a benchmark, spread duration, and a watchlist of issuers within one notch of investment-grade. The speculative-grade default rate ended 2024 at 4.1%, above its long-term average of 4.6% (Moody’s, 2024), which makes credit monitoring essential for any portfolio with BBB or below exposure.
How often should a family office produce a fixed income report?
A monthly close with quarterly principal-facing review is the working standard at most family offices. Daily exposure dashboards (duration, large-position concentration, watchlist movements) are increasingly common where the underlying platform supports real-time custodian feeds. The cadence that matters is time-to-decision, not report frequency. A daily report no one reads is worse than a monthly one the principal actually opens.
What is the most common mistake in family-office fixed income reporting?
The most common single mistake is reporting yield and return at the consolidated level without showing the after-tax number at the entity level. A family balance sheet with a non-grantor trust, a taxable LLC, and an offshore PIC will produce three different after-tax yields on the same bond. The report has to show all three, or it is materially misleading.
Alternatives Reporting: From Below the Line to All of the Above