
What is our net worth? This question comes up in almost every major client conversation. It sounds simple, but it rarely is.
In a family office managing $100M+ in assets, net worth is not a single number pulled from one system. It is the outcome of reconciling many moving parts across the full wealth structure.
Net worth also depends on how ownership is defined across trusts, holding companies, partnerships, and family members. It reflects how interests are split, consolidated, or excluded. It changes based on entity relationships, control versus economic ownership, and how intercompany balances are treated.
Valuation adds another layer of complexity. Public market assets update daily. Private investments report on irregular cycles. Real estate values lag the market and rely on appraisals or internal estimates. Operating businesses introduce assumptions around multiples, cash flows, and minority discounts. Each value has a different level of confidence and freshness.
Currency, leverage, and timing further affect the outcome. Global families deal with multiple base currencies. Debt sits at different entity levels. Reporting cutoffs matter. A single distribution, capital call, or asset transfer can materially change the picture depending on when it is captured.
By the time everything is assembled, the final net worth number often requires as much explanation as calculation. Without a clear structure behind it, even accurate data can be difficult to trust or reuse.
Key Takeaways
The Role of the Global Wealth Map

Net worth stops being a math problem once the full wealth structure is centralized and complete.
The challenge is not visibility alone. It is fragmentation. Information lives across custodians, entities, advisors, and files. Until every entity is accounted for and mapped to the correct owners, totals will always be questioned.
With a complete and centralized model, net worth becomes explainable, defensible, and repeatable. Moreover, changes over time can be tracked without rebuilding the logic each reporting period.
In Masttro, net worth reports are a direct output of the Global Wealth Map.
The Global Wealth Map defines the full wealth structure first. Every entity is accounted for. Ownership is mapped. Assets and liabilities are placed in context. From that model, net worth reports are generated automatically and can be shared with the wealth owner though a Secure Communication Portal.
This makes net worth reporting safe, repeatable and defensible. The same logic is applied every period, even as holdings change, valuations lag, or new entities are added. Reports update without rebuilding assumptions or reconciling spreadsheets.
As a result, net worth reporting becomes the core operating view for the family office. It supports portfolio decisions, liquidity planning, tax work, risk oversight, and governance, with all stakeholders working from the same structure and the same source of truth.
This article explains how family offices use net worth reports in Masttro, built on the Global Wealth Map, to move from manual reconciliation to a consistent close process.
1) Total Net Worth Report: Portfolio Overview
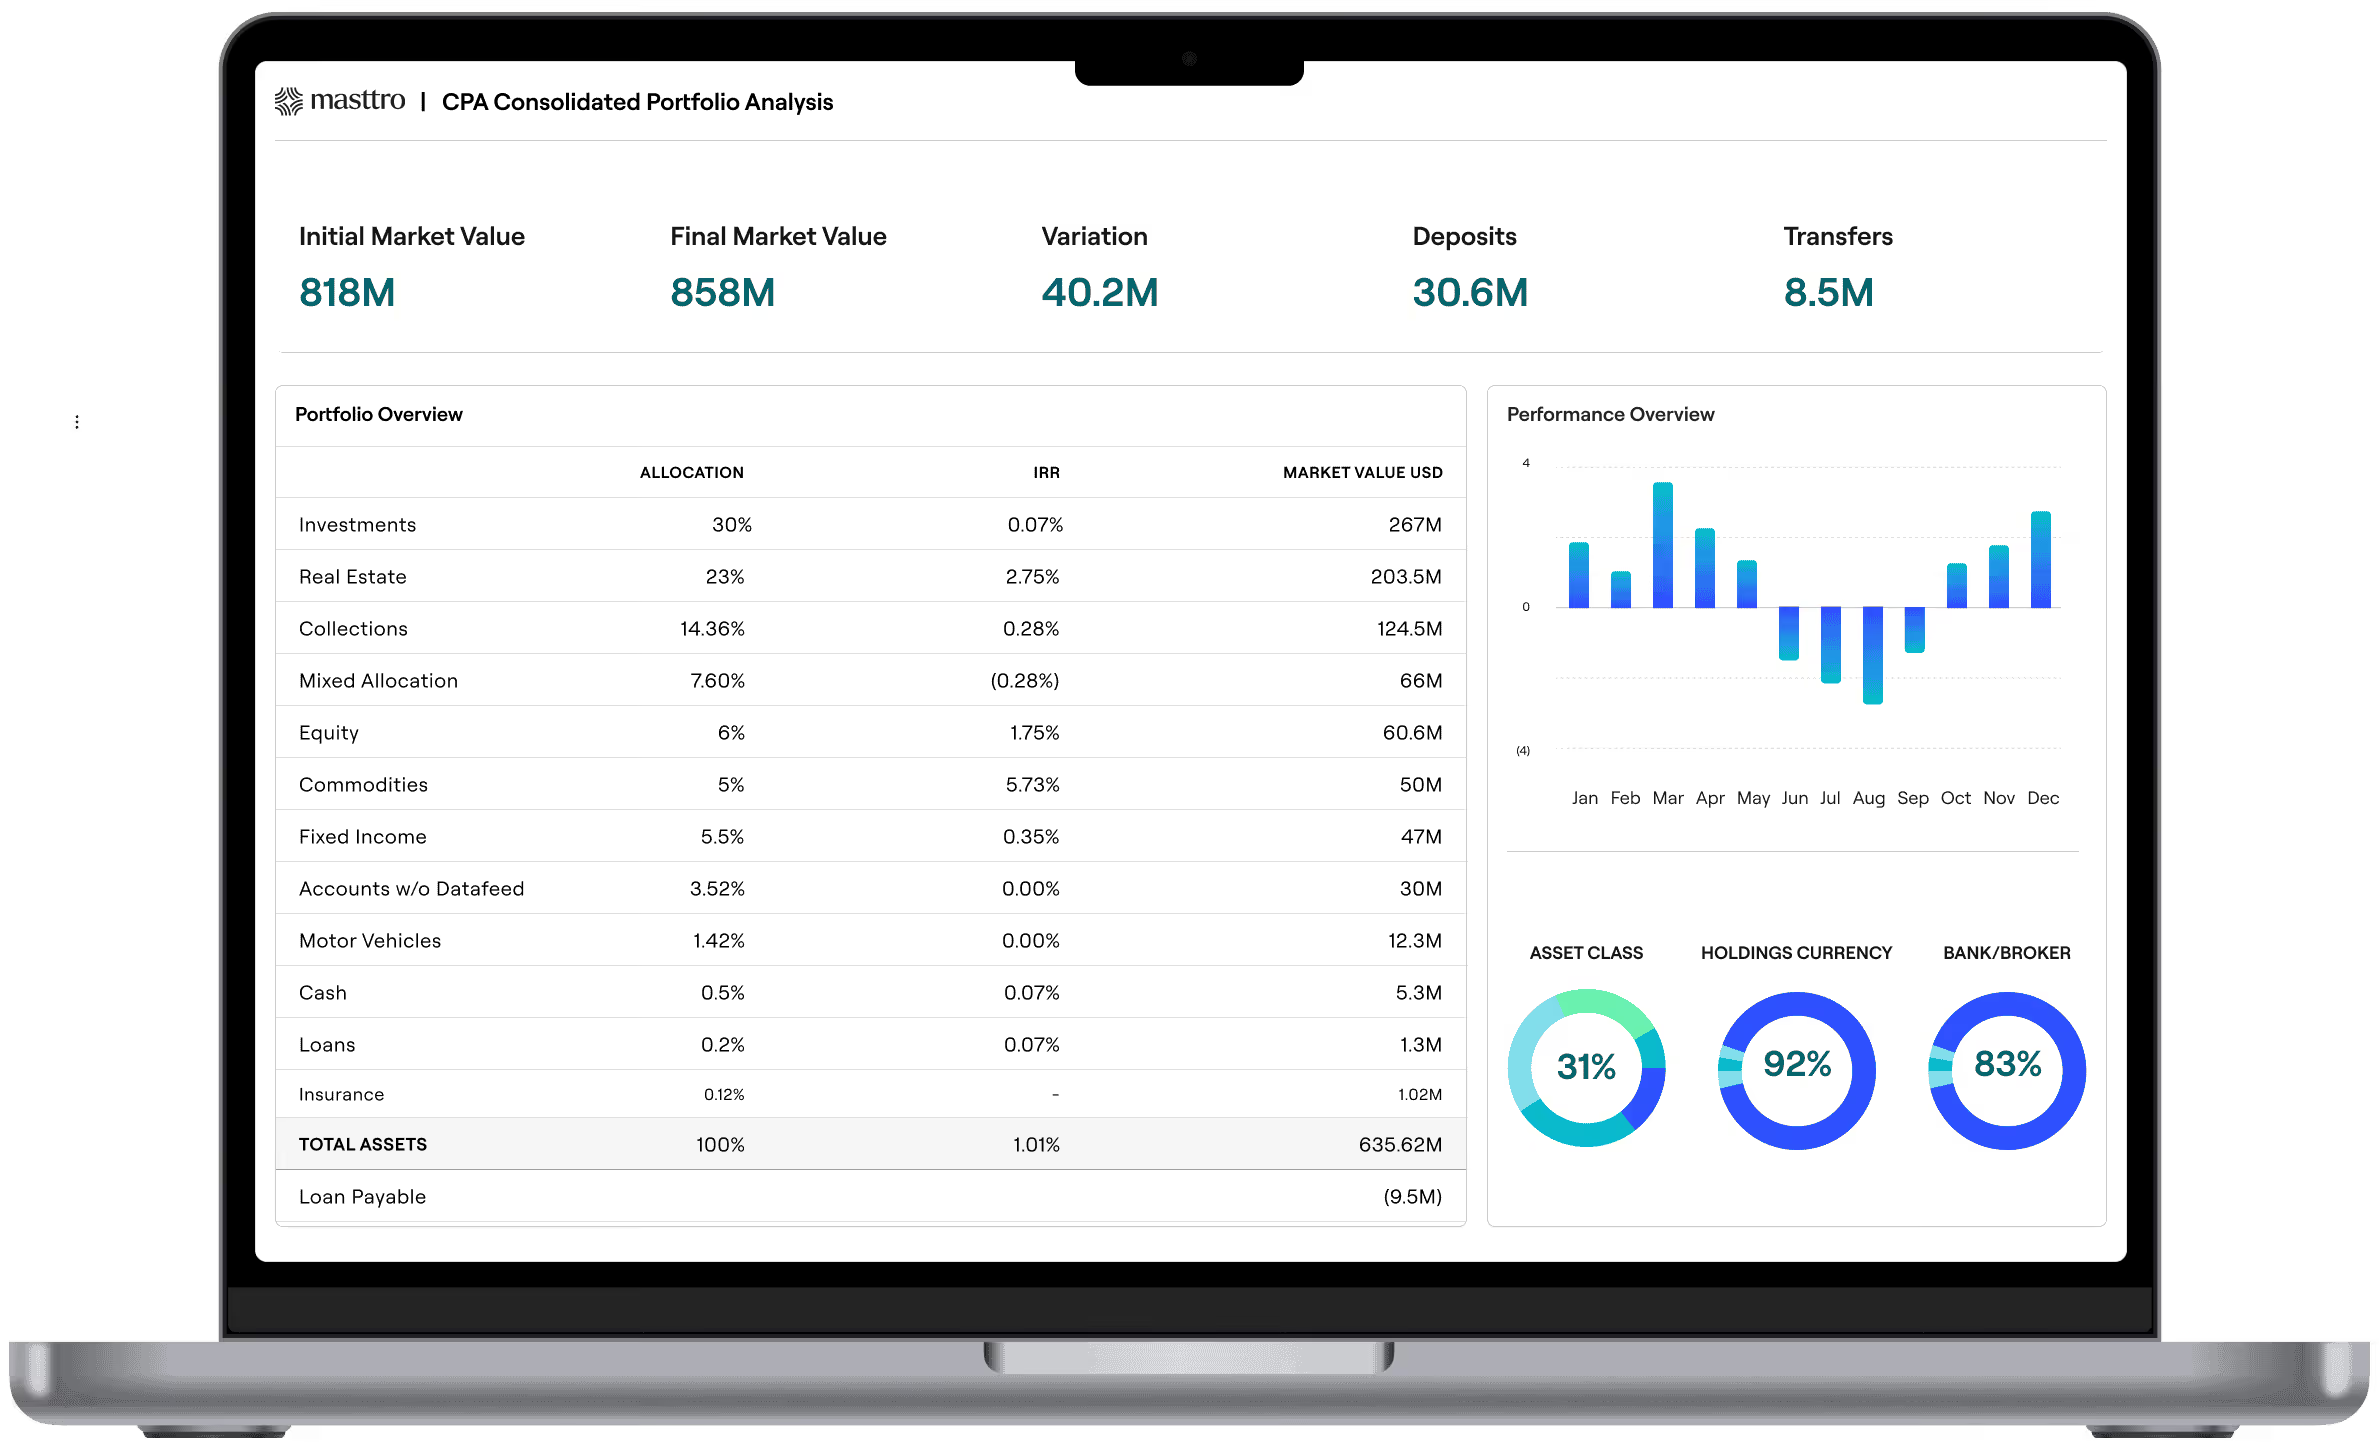
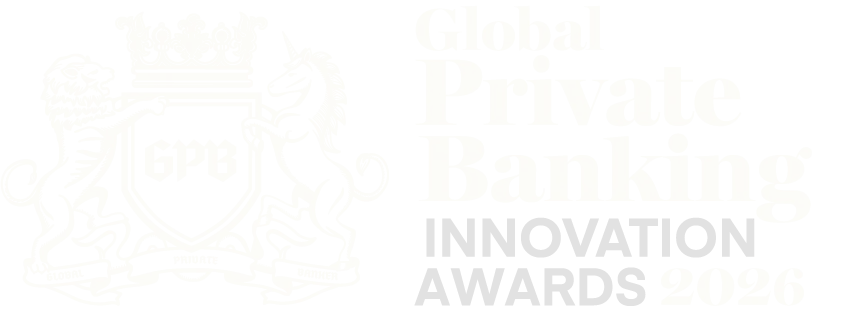
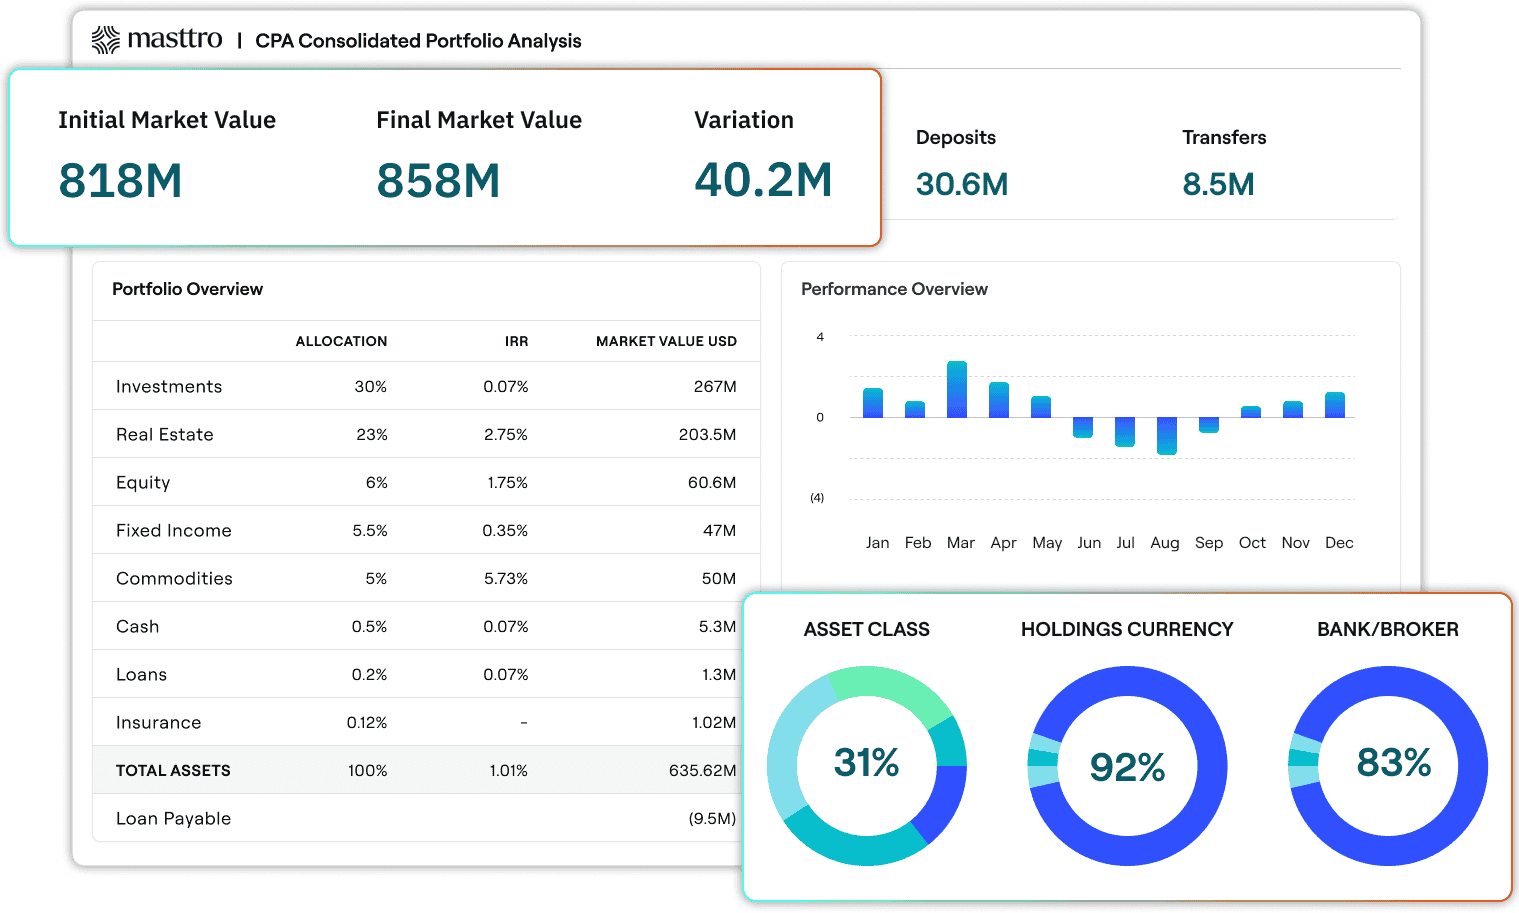
The Portfolio Overview is the front page of the net worth report. It gives a short, decision-ready snapshot of the estate at a point in time and sets the context for the rest of the supporting information.
This overview anchors the report with clear parameters. These include the period covered, the reporting currency, and data freshness indicators. It summarizes beginning and ending market values, net change over the period, deposits and withdrawals, transfers in and out, profit or loss, and internal rate of return. This gives principals and advisors a quick view of what changed and why.
Below the summary, asset class allocation appears in both table and chart form. Each asset class shows its share of the portfolio, market value, and performance. This makes concentration and balance easy to see. Visuals reduce the need to read dense tables during meetings and speed up review.
The Portfolio Overview also introduces exposure lenses that show up in later sections. These include holdings currency, sector exposure, and geographic distribution. This creates continuity across the report and surfaces major risk concentrations early.
The Portfolio Overview report provides:
- Immediate clarity on total net worth and period movement
- Faster orientation for principals and advisors
- A consistent starting point for investment, risk, and governance talks
Five Dashboards Every Wealth Owner Needs

2) Holdings Statement
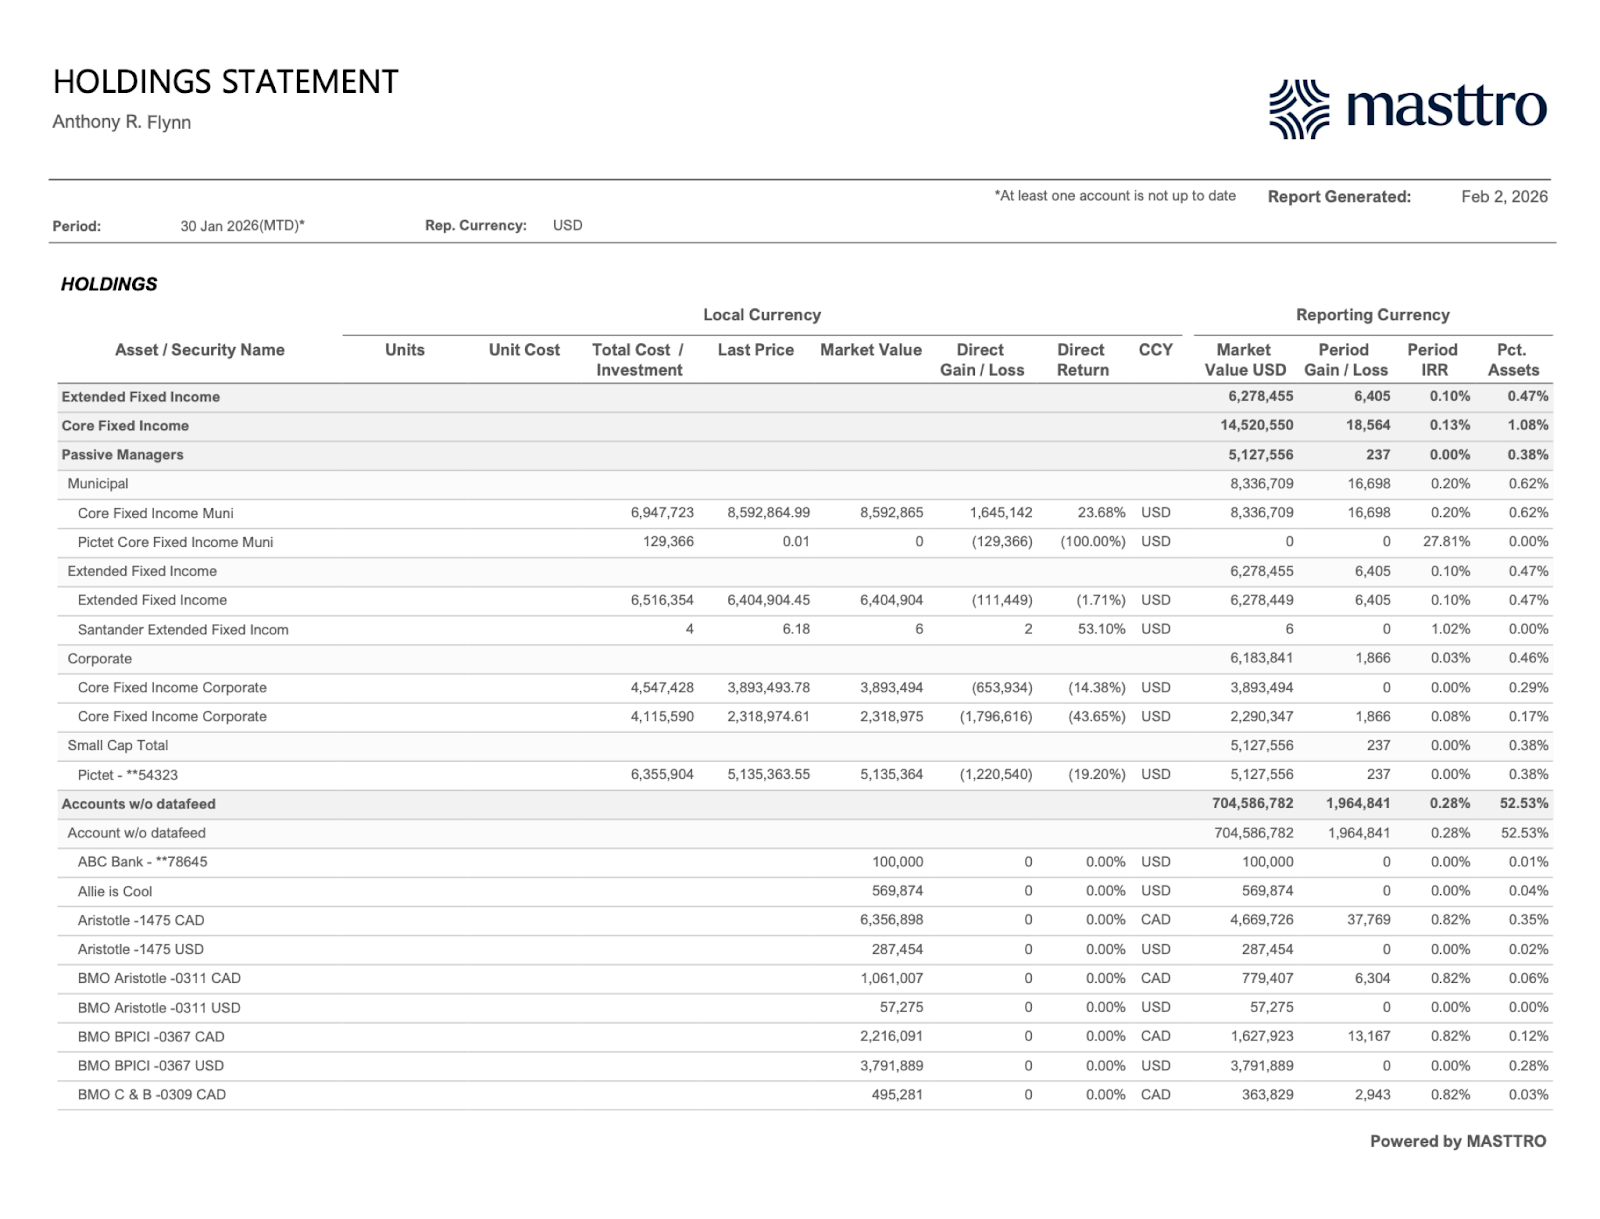
The Holdings Statement is the detailed source behind the net worth number. It lists every position in the report and shows the data needed to confirm value, exposure, and performance at the security level.
Holdings appear as of the reporting date and are grouped by asset class, strategy, and account. The report shows which assets are supported by automated data feeds and which are updated without direct feeds. This makes data coverage and reliability clear.
Each line includes valuation and performance fields in one place. Valuation detail supports tie-out work. It includes units held, unit cost, total invested amount, last price, market value in local currency, and market value in the reporting currency. Performance fields explain movement: direct gain or loss, direct return, period gain or loss, and period IRR. The report also shows percent of total assets for each line, which highlights concentration and outsized exposures that may be hidden in summaries.
The Holdings Statement provides:
- Full transparency into every position that drives net worth
- Clear separation between valuation moves and performance results
- Reliable tie-out from total net worth to individual holdings
- Strong support for audit, performance review, and internal checks
3) Asset Allocation and Performance Overview
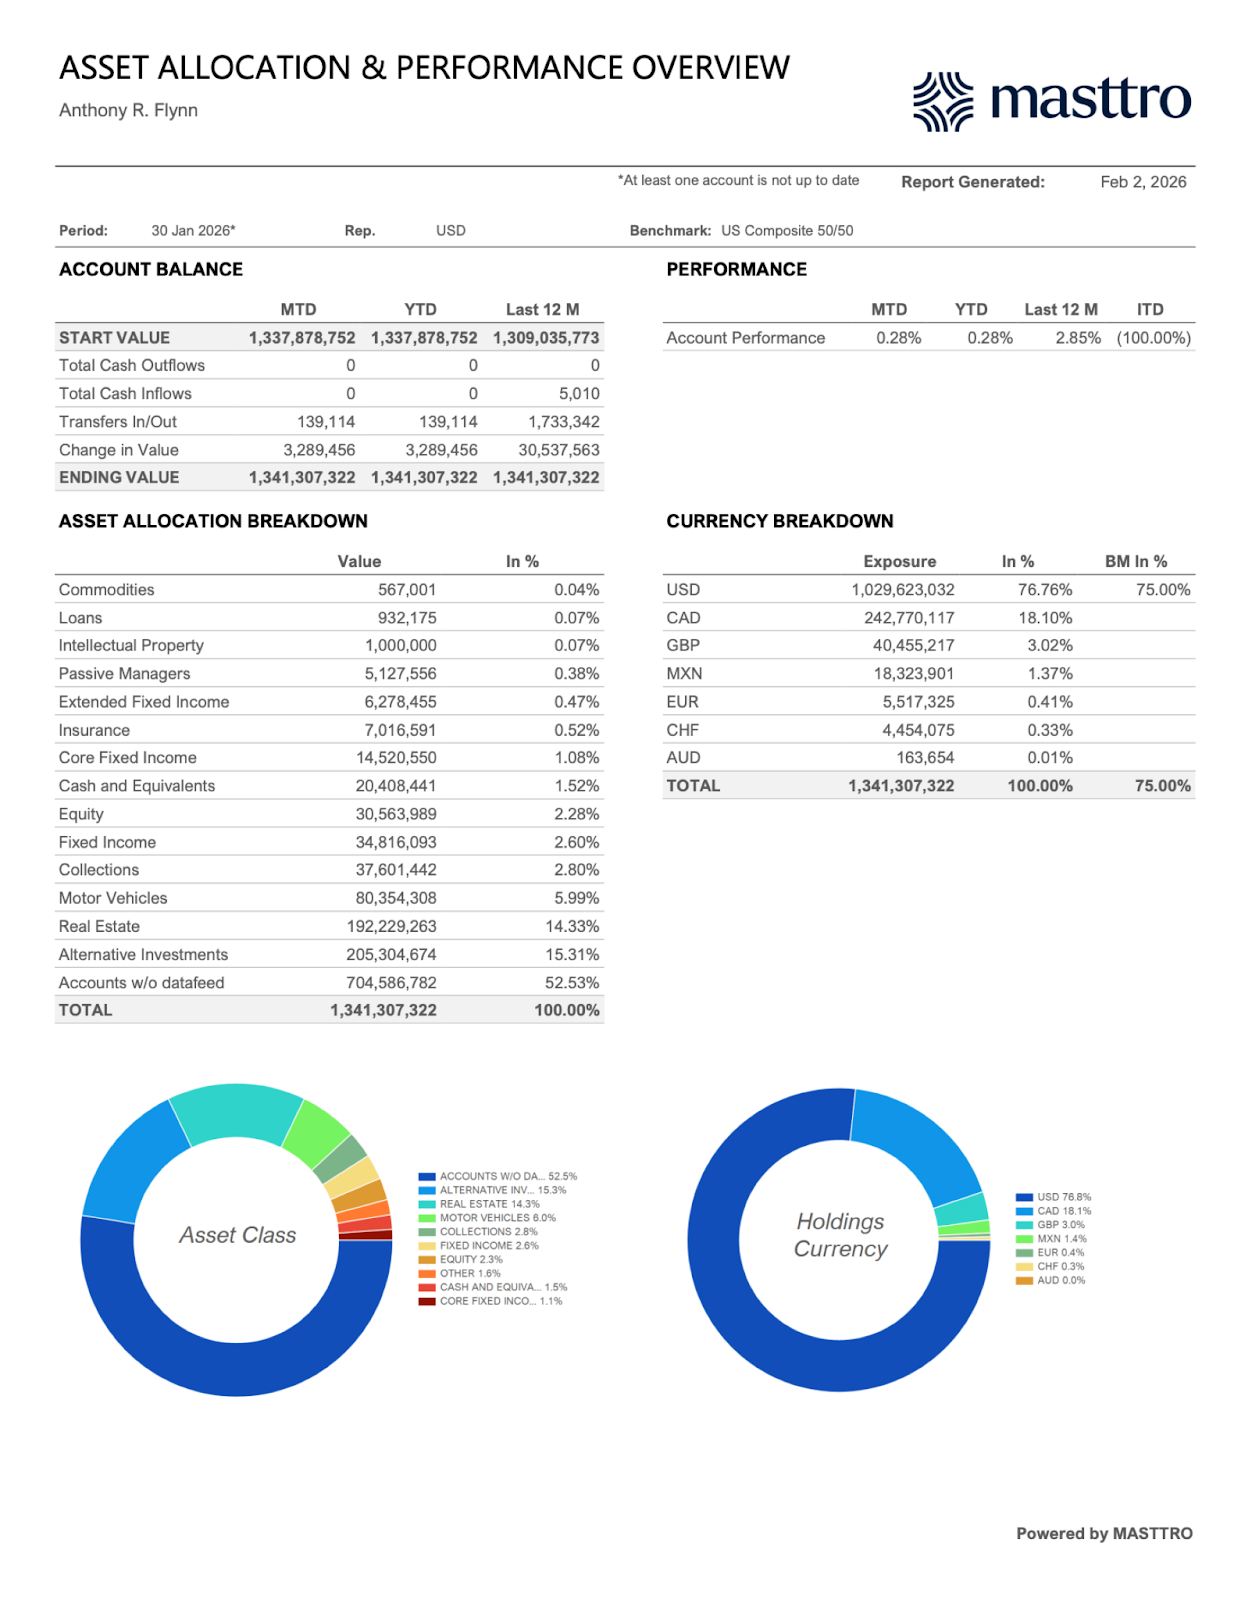
The Asset Allocation and Performance Overview shows how the portfolio is positioned and how it has performed over time. It links value changes, cash flows, and performance into one view that supports review and action.
This report summarizes account balances across several timeframes, such as month-to-date, year-to-date, and trailing periods. It separates starting value, cash inflows and outflows, transfers, and change in value. This makes it easier to see what came from activity and what came from market performance. Performance results appear next to these figures over standard periods and are compared to a chosen benchmark.
The report also breaks down market value by asset class and currency. Tables show exact values and percentages. Charts reinforce messages about concentration, diversification, and currency exposure without forcing readers to parse every line. This section acts as a bridge between the executive view and the detailed holdings statement.
The Asset Allocation and Performance Overview provides:
- Clear view of what drove portfolio change across timeframes
- Immediate visibility into asset class and currency exposure
- Strong context for performance talks and allocation choices
- Natural transition from high-level review to deeper analysis
4) Geographic and Currency Reporting
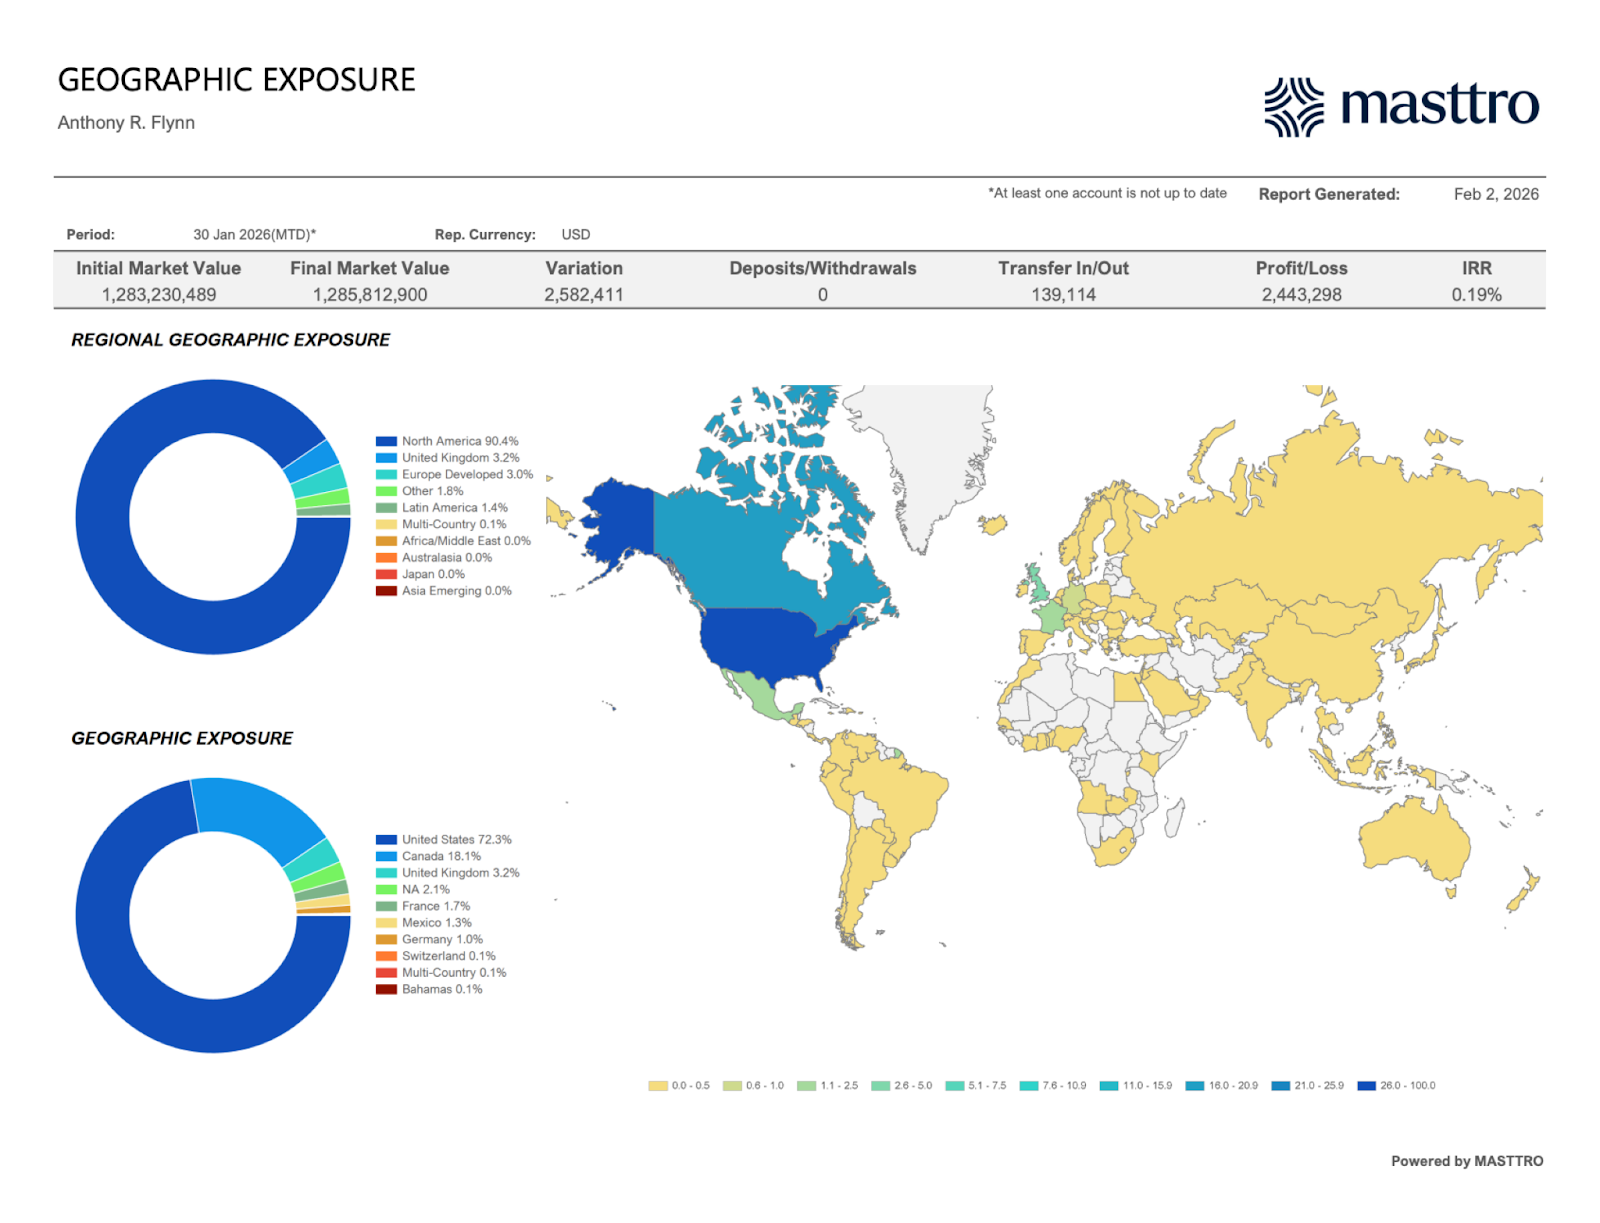
The Geographic Exposure report shows where portfolio value sits across regions and countries. It helps frame legal, political, and broad market risk.
The report summarizes beginning and ending market values for the period and shows how much change came from transfers and from investment results. It then breaks exposure down by region and by country. This allows a quick high-level scan and also highlights specific geographic dependencies.
Visuals support faster reading. Regional and country charts show proportional exposure. A world map view turns those numbers into an intuitive picture of concentration and spread. Because geographic exposure cuts across asset classes and custodians, this report gives a cross-portfolio lens that is helpful in diversification and governance discussions.
The Geographic Exposure provides:
- Clear visibility into regional and country-level concentration
- Faster spotting of geographic risk and imbalance
- Better support for diversification and location planning
- Richer context for investment and governance talks
5) Last Valuation Dates
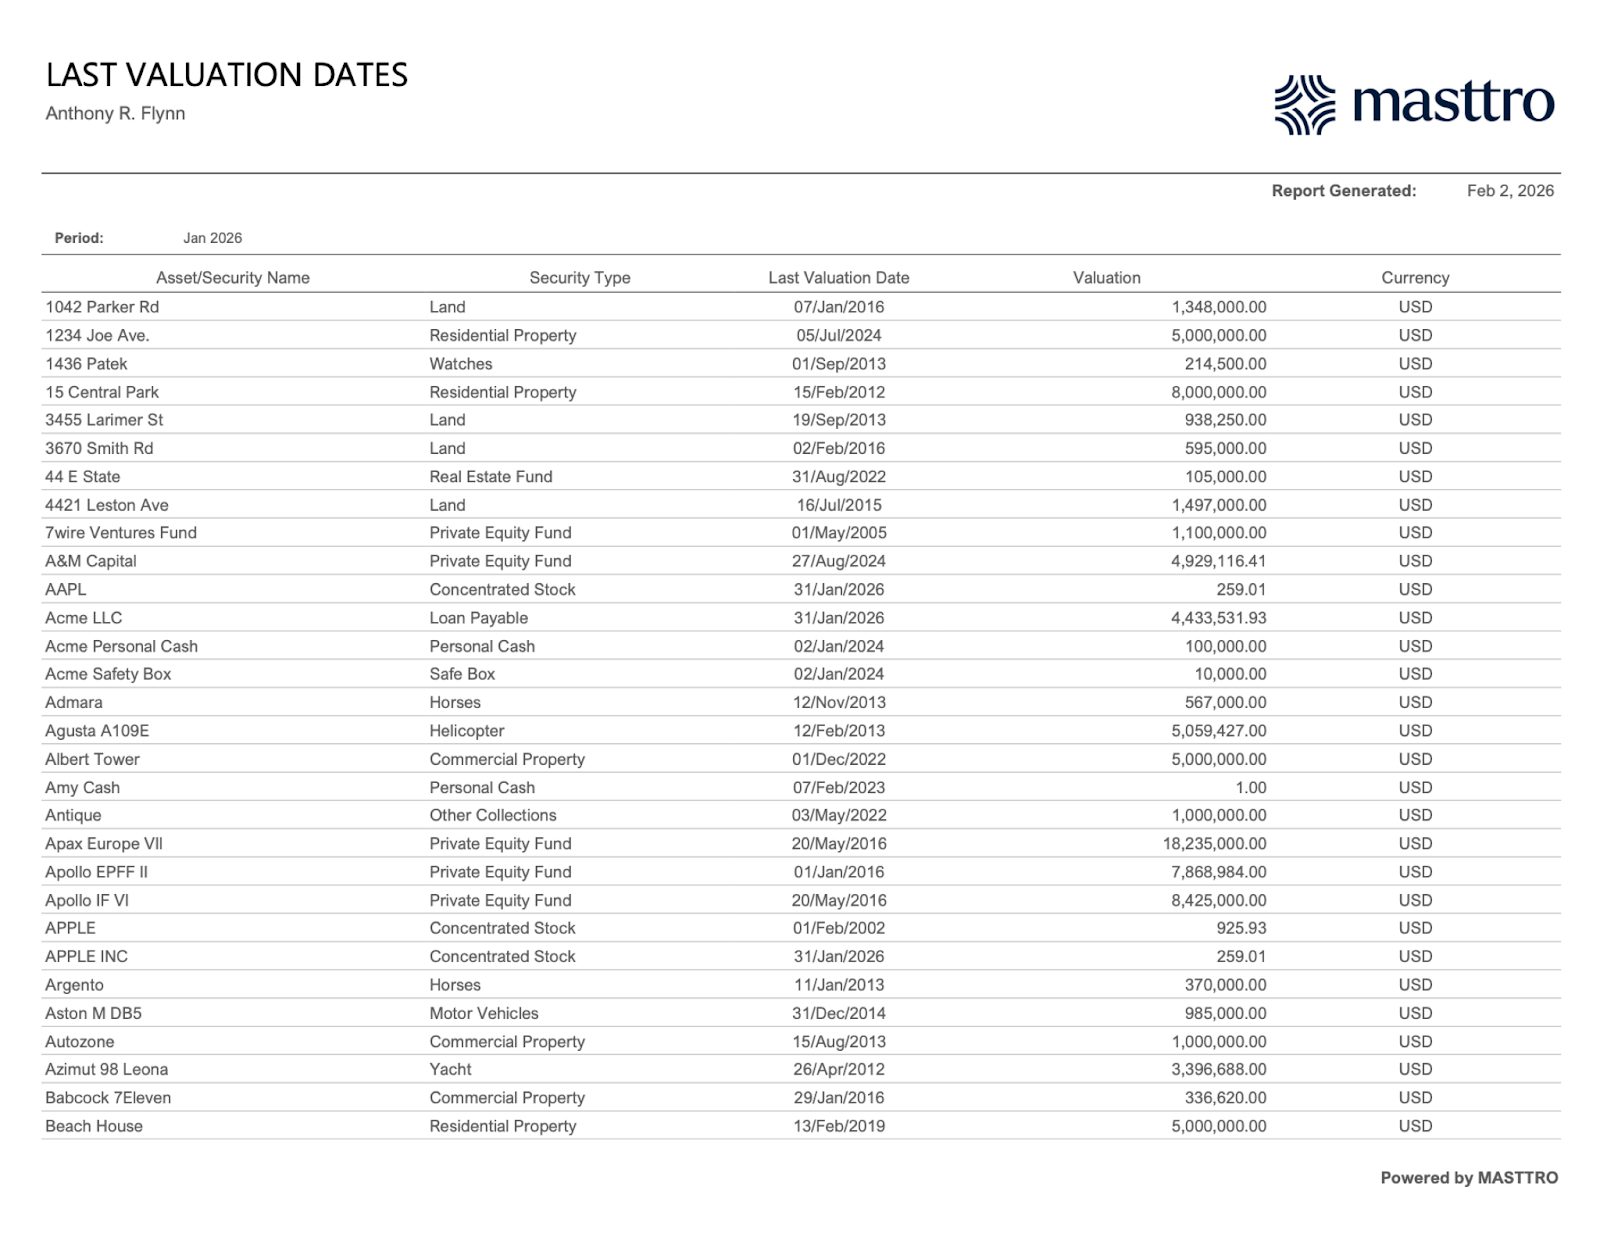
The Last Valuation Dates report is a key control. It answers a question that matters in every net worth review, especially when private assets and direct holdings are involved:
How current are the values in this report?
This report lists each asset with its security type, most recent valuation date, valuation amount, and currency. By placing valuation dates next to asset values, the report makes data freshness explicit. This is critical for private equity, real estate, collectibles, operating assets, and other holdings that do not update every day.
The report makes it easy to spot stale valuations, lagging marks, and holdings that may need a new appraisal, a manager statement, or internal review. It also helps manage expectations with principals and advisors by showing where precision is high and where timing adds uncertainty.
In summary the Last Valuation Dates report provides:
- Clear view of valuation freshness across the balance sheet
- Faster detection of stale or outdated values
- Stronger confidence in reported net worth totals
- Better support for audit, tax, and governance work
How Masttro Supports Best-in-Class Net Worth Reporting
Net worth reporting works best when supported by software built for the complexity of family offices. Masttro family offices and wealth advisors of UHNWI by organizing net worth reporting around three basics:
- Aggregation
- Structure
- Controls
Aggregation Across Sources
Masttro pulls holdings from custodians, banks, and administrators into one view. This reduces manual reconciliation and the version drift that comes with spreadsheet-heavy workflows. Reporting currency and FX treatment follow a clear policy, which keeps results consistent across periods and across households.
Structure With Entity-Based Reporting
Net worth is not useful without ownership structure. Masttro supports entity-based roll-ups tied to trusts, holding companies, and layered structures. This makes it possible to report net worth in a way that matches how the estate is truly organized.
Controls That Keep Totals Defendable
Controls separate a report that only looks complete from one that stands up to review. Masttro supports clear visibility on valuation freshness, strong governance over security data and classifications, and appendices and exports that support audit, tax, and operations work.
Net Worth Reports That Scales
A scalable net worth report depends on repeatability. When you utilize a purpose-built family office software, you no longer need to depend on last-minute heroics at the close to keep your client happy.
If you want to turn your net worth report into a repeatable, defensible operating tool, consider putting this structure in place with Masttro. Talk to our team about how your current data sources, entities, and controls can fit into a single tool.
Start a conversation with Masttro today to see how your family office can scale net worth reporting with less manual work and more confidence in every number you present.